 |
|
|---|
Computational Materials: Overview
|
|
|---|
|
TABLE OF CONTENTS |
|---|
|
|
 |
|
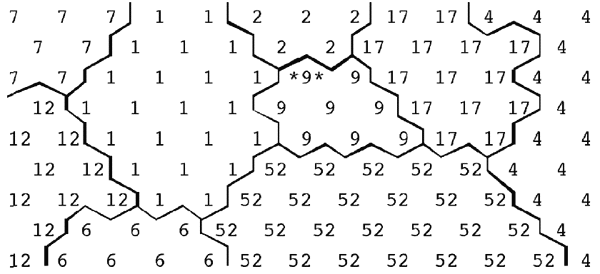
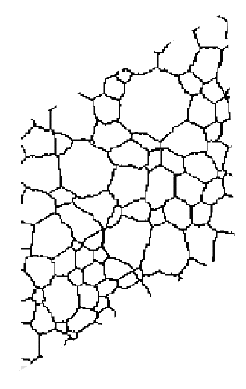
Figure 1. A grain structure bitmapped onto a triangular lattice. Each lattice site represents a unit area of the microstructure; numerals indicate the grain in which a site is embedded. |
|
|
This paper reviews the kinetic Monte Carlo Potts model for simulating microstructural evolution. When properly implemented, that model provides a fast and flexible tool for evaluating a variety of materials systems in two and three dimensions, generating snapshots of the evolving microstructure with time. Examples of the model are provided, along with potential applications.
Metallurgists and ceramists have long recognized that most
apparently homogeneous materials in fact possess several levels of structure
between the atomic and the macroscopic. These substructures, generally termed
microstructure, include dislocation networks, precipitate dispersions, grain
arrays, phase distributions, and engineered substructures. Understanding microstructure
is critical because it governs the mechanical, thermal, and electrical properties
of engineered materials. Because of its importance, researchers have observed,
analyzed, and modeled microstructural evolution for over a century.1
Computational simulations of evolving microstructures have been performed for
half that long, beginning with Fullman,2
who simulated grain growth in a polycrystal and did all his calculations manually.
While analytical models predict ensemble characteristics of microstructural
evolution (i.e., particle spacing and grain size distribution), the goal of
mesoscale computational simulations is rather different: to generate snapshots
of the evolving microstructure with time. Using the computational version of
metallography, both local and ensemble properties of the microstructure may
be determined from these snapshots.
One class of microstructural phenomena concerns the evolution of internal interfaces
in polycrystalline materials. These interfaces may divide two grains of unlike
crystallographic orientation (grain boundaries) or two regions of dissimilar
thermodynamic phase (phase boundaries). Internal interfaces may evolve to minimize
internal surface energy via grain growth or Ostwald ripening. Alternately, they
may move due to a volumetric change such as recrystallization or a phase transition.
In both cases, microstructural development depends upon the local topology and
connectivity of microstructural features, so mesoscale computer simulations
are valuable. The most successful mesoscale simulations for microstructural
evolution include Potts models,3
front tracking models,4
vertex models,5 phase
field models,6 and cellular
automata.7
While each model has its strengths, each gives the same answers
when properly implemented.8-10
Therefore, this paper focuses on the kinetic Monte Carlo Potts model for mesoscale
simulations of microstructural evolution.
The Potts model was developed 50 years ago as an extension
to the ferro-magnetic Ising model for magnetic domain evolution.11
In the Ising model, every point on a discretized domain structure is assigned
a magnetic spin state (i.e., spin up or spin down); the structure evolves to
minimize the boundary between spin-up and spin-down domains. The Potts model
is a generalization of the Ising model to systems with an arbitrary number of
different, magnetic spin states.
About two decades ago, similarities between Potts domain structures and grain
structures were recognized. Because both systems are characterized by a space-filling
array of cells (i.e., grains or domains) that evolve to minimize boundary area,
the Potts model was proposed as a model for grain growth in polycrystals.3,12,13
Since then, Potts simulations have modeled a variety of microstructural phenomena,
including grain growth in single-phase,14
two-phase,15 and composite
systems,16 directional
grain growth,17 particle
pinning,18,19
recrystallization,20,21
Ostwald ripening,22 solidification,23
late-stage sintering,24
and many others.
The Algorithm
In the Potts model, a continuum microstructure is bitmapped onto a lattice.
Each lattice site i is allocated an index si
so that all sites within a grain have the same index, and grain boundaries are
interfaces between neighboring sites of unlike index, as shown in Figure
1. The mapping procedure is analogous to color bitmapping the grain structure;
grains are clusters of pixels (sites) of the same color (index). In addition
to indicating to which grain a site belongs, the site indices may also contain
information such as phase or crystallographic orientation, which are used to
determine the properties of each site.
The total system energy is given by the Potts Hamiltonian:
 |
(1)
|
where g is the energy of a unit of boundary between
sites of index si and sj
in units of the Boltzmann constant k, F is the volumetric energy of a site of
index si in units of k, and the sums are taken
over the n sites within the neighbor shell of site i and for all N lattice sites.
Equation 1 sums all interfacial and volumetric contributions
to the system energy.
Because g and F can take any form, this Hamiltonian
can define many systems. For example, boundary energy g
might depend on the crystallographic misorientation between two grains of different
index, or volumetric free energy for a phase transition F might depend on the
local solute concentration.
Evolution is simulated by selecting a site at random and choosing a candidate
index from the set of unlike neighbor indices. (Note that the index selection
is not weighted by the number of neighbors possessing that index.) The change
in system energy DE for reorienting the index of
the site to the candidate index is calculated using Equation
1. The reorientation is performed with probability P(DE)
given by
|
(2)
|
which for T = 0 reduces to
 |
(3)
|
where po is the reduced mobility of the boundary
between sites of index si and sj
. kT is an energy defining the thermal fluctuation of the simulation and in
practice determines the amount of noise present in the system. After each reorientation
attempt, the time clock is incremented by 1/(NQ) Monte Carlo steps (MCS), where
Q is the number of allowed indices.
An example can clarify the algorithm.
In the bitmapped structure shown in Figure
1, assume that boundary energy is isotropic, such that g(si,sj)
= g, and that volumetric free energy F is uniform
for all sites. These parameters correspond to normal, isotropic grain growth.
A random site is selected, indicated by asterisks in Figure
1. Its initial index is si = 9. Its initial
energy includes 3g units of boundary energy plus
F units of volumetric energy. Next, a new index is selected from among the unlike
neighbor indices; that is, either index 1 or index 2 is selected with equal
probability. Consider the selection of index 2. If the site were to reorient
to index 2, its energy would include 4g units of
boundary energy plus F units of volumetric energy, a net increase of g
units of energy, so DE = g.
At T = 0, this reorientation never occurs; at finite T, it occurs with probability
given by Equation 2 with DE =
g. Reorientation is performed if merited, the time
clock is incremented by 1/(NQ) timesteps, and another site is selected at random.
After many reorientation attempts, grain growth would be observed, with large
grains growing at the expense of small ones.
|
|
 |
|
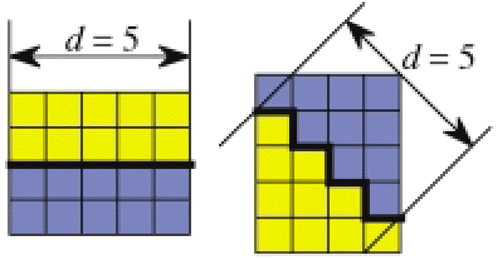
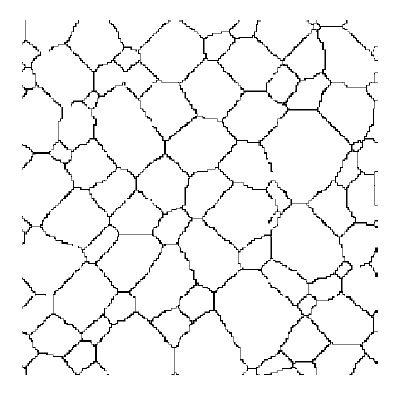
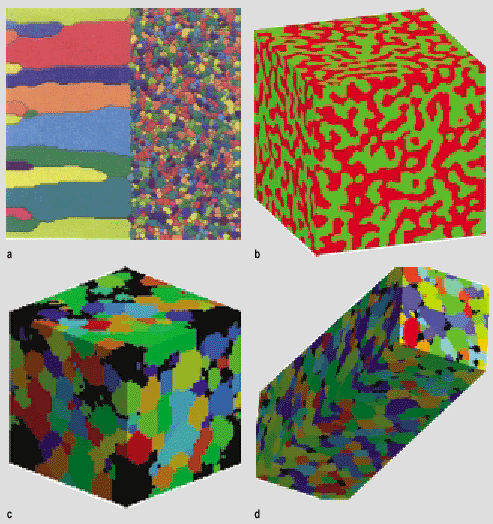
Figure 2. Lattice effects in the Potts model. (a-left) A boundary separating endpoints d = 5 units apart contains five bound-ary segments if drawn in the <01> direction of a square lattice. (b-right) The same boundary contains seven boundary segments, and commensurately more boundary energy, if drawn in the <11> direction. |
|
|
In the Potts model, the underlying lattice simplifies computation significantly,but
it also can alter the simulation results. In fact, lattice effects are the most
common cause of invalid or nonsensical results in Potts model simulations.
Consider a boundary connecting two points separated by distance d. On a square
lattice the boundary will incorporate fewer segments if it lies in a <01>
direction (d segments) than if it lies in a <11> direction (approximately
![]() segments),
as shown in Figure 2. Since the Potts
model minimizes system energy by decreasing boundary length, there is a driving
force to place boundaries along lattice facets. This results in grain shapes
that mimic the underlying lattice symmetry, as shown in Figure
3a, and growth kinetics tend to slow or stop as evolution progresses.25
These lattice effects are more pronounced in systems that require fine distinctions
in boundary energy,15
in three-dimensional (3-D) systems, and in systems with other pinning mechanisms.18
Since these lattice effects are non-physical, they must be eliminated from grain-growth
simulations.
segments),
as shown in Figure 2. Since the Potts
model minimizes system energy by decreasing boundary length, there is a driving
force to place boundaries along lattice facets. This results in grain shapes
that mimic the underlying lattice symmetry, as shown in Figure
3a, and growth kinetics tend to slow or stop as evolution progresses.25
These lattice effects are more pronounced in systems that require fine distinctions
in boundary energy,15
in three-dimensional (3-D) systems, and in systems with other pinning mechanisms.18
Since these lattice effects are non-physical, they must be eliminated from grain-growth
simulations.
Lattice effects operate by faceting boundaries. They can be overcome by injecting
a sufficient number of random steps onto the boundaries. Then, step flow processes
can allow the boundary to find and track its energetically favored position,
restoring correct grain junction angles and permitting free boundary motion.
In practice, lattice effects are mitigated in two ways.25
Increasing the neighbor sampling per site decreases the energetic anisotropy
of the lattice. This can be accomplished either by changing the lattice symmetry
(i.e., from square [four nearest neighbors] to triangular [six nearest neighbors],
as shown in Figure 3b), or by maintaining
the lattice symmetry and adding shells of interacting neighbors (i.e. including
second nearest neighbor interactions in Equation 1, as shown
in Figure 3c). Alternately, the simulation
temperature T can be increased to activate thermal fluctuations that roughen
the boundaries, as shown in Figure 3d.
Given a lattice, the correct T is found by trial and error. Generally, T is
increased until grains are equiaxed, junction angles are correct, and growth
kinetics converge. It should be noted that T is not a real temperature. It simply
alters the transition probability function and, by doing so, allows noise to
be introduced into the system.
|
|
|||
 |
 |
 |
 |
|
a
|
b
|
c
|
d
|
|
Figure 3. Lattice effects in Potts model simulations of isotropic, single-phase grain growth. (a) On the square lattice with first neighbor interactions, boundaries are faceted along the <01> lattice directions, and grain growth stops. (b) Lattice effects are decreased by changing to the triangular lattice, or (c) by adding second neighbor interactions on the square lattice. (d) Despite the faceted appearance, when the simulation temperature is increased to T = 0.28, there are sufficient steps on the boundaries to permit normal growth on the square lattice. |
|||
|
|
|||
Reality Check
By comparing the results of various Potts model simulations to theoretical
predictions, the Potts model has been shown to reproduce the salient features
of a variety of microstructural evolution processes. Theoretical justification
for why the model works is less complete. However, it has been shown that using
Equation 1 with boundary energy terms only (i.e., F = 0)
produces boundary motion by mean curvature, in agreement with grain-growth theory.26
Similarly, Equation 1 with volumetric energy only (i.e.,
g = 0) produces growth of a nucleus consistent with
recrystallization or diffusionless phase transformation.27
When both terms of Equation 1 are finite, Raabe and Rollett
suggest that a hybrid algorithm may be called for.27
|
|
|
|
 |
 |
|
|
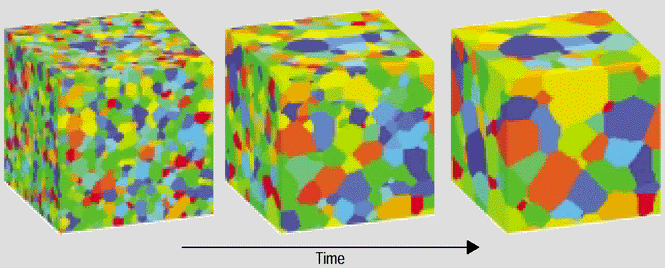
Figure 4. A Potts model simulation of isotropic, single-phase grain growth in a polycrystal. Color corresponds to the site indices. Over time, average grain size increases as large grains grow at the expense of small grains. |
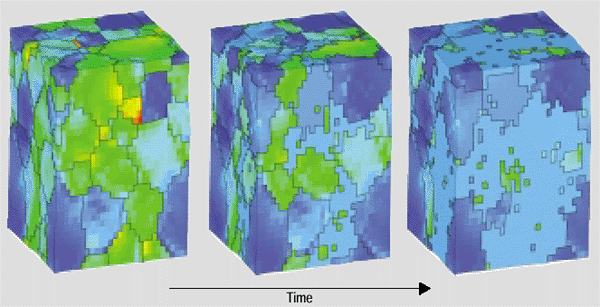
Figure 5. A Potts model simulation of recrystallization in an in homogeneously strained polycrystal. Color corresponds to stored plastic energy where blue is low and red is high. Low energy nuclei grow at the expense of high-energy sites, ultimately resulting in a coarse-grained structure of low stored energy. |
|
|
|
|
Two approaches have been used to compare Potts model simulations to experimental
systems. First, since the dimensionless Potts model length and time scales are
proportional to real length and time scales, data point matching can connect
Potts and experimental results.28
To perform this data point matching, an experimental microstructure is digitized
and becomes the initial Potts structure. Since this mapping causes a certain
number of Potts sites to correspond with a certain real length, the initialization
sets the length scale for the simulation. The experimental microstructure is
then processed, and a Potts simulation generates a microstructure statistically
equivalent to the real, processed structure. The Potts time required to reach
this microstructure corresponds to the real processing time, and thus sets the
time scale.
As an alternate approach to mapping the Potts model to real systems, Raabe has
derived expressions for the Potts model inputs (g,
F, and po) in terms of physical parameters.29
Using these expressions in Equations 1 and 2
will result in Potts model output expressed in real, physical units.
Finally, it should be noted that Potts model simulations are generally performed
using a fast algorithm that avoids attempting unsuccessful reorientations.30
While more complicated than the scheme outlined above, it gives the same results
in far less computer time.
The first application of the Potts model to microstructural evolution was for isotropic, single-phase grain growth.3 In this system, Equation 1 is written such that boundary energy is isotropic (i.e., g(si,sj) = g), and volumetric free energy F is uniform for all sites. A typical evolution sequence for a 3-D grain growth system is shown in Figure 4. The simulated microstructures may be analyzed to find the change in grain size distribution with time, the kinetics of average grain size, the size correlation between neighboring grains, and so on.31 In fact, the first major success of the Potts model was to confirm that the average grain radius increases by a power law in time, <R> ~ tn, with asymptotic exponent n = 0.5 in both two and three dimensions.3,14 This result laid to rest a long-standing debate about the value of n, which arose because experiments often produce an exponent less than 0.5. Later, Potts model simulations of highly textured microstructures demonstrated that decreasing the mean boundary misorientation can decrease the growth exponent, as observed in experiments.32 Potts model simulations for normal grain growth have been equally important in evaluating theories for the steady-state grain size distribution, providing data on the topology of 3-D grain structures, and comparing the features of 2-D and 3-D grain growth. Furthermore, these simulations have been extended to examine texture effects,32 anisotropic boundary energy,33 abnormal grain growth,34 particle pinning,18,19 and many other phenomena that affect the progress of grain growth during annealing.
|
|
|
|
 |
 |
|
|
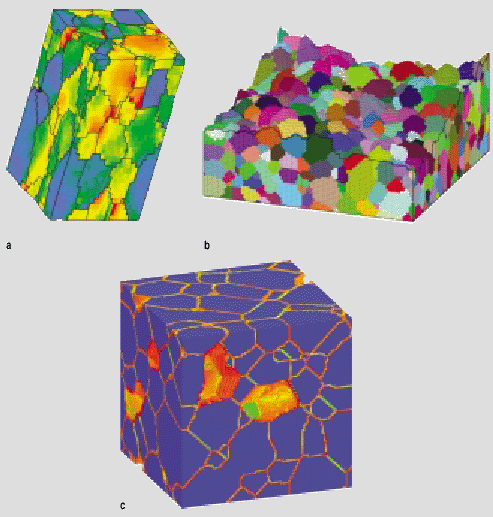
Figure 6. Other applications of Potts model simulations: (a-top left) Columnar grain growth during zone annealing, (b-top right) coarsening of a eutectic microstructure, (c-bottom left) abnormal grain growth (black grains) in a polycrystal with anisotropic grain boundary energies, and (d-bottom right) porosity in a sintered ceramic. Black pixels are pore sites. |
Figure 7. Some materials response simulations of Potts model microstructures: (a-top left) Critical resolved shear stress in a randomly textured, polycrystalline copper specimen deformed 40% in tension, as determined using a polycrystal plasticity finite element calculation. Red is high stress, and blue is low. (b-top right) Intergranular fracture of an equiaxed polycrystal with uniformly weak grain boundaries. (c-bottom) Flux of solute in a porous polycrystal in which grain boundaries and pore walls are fast diffusion “pipes.” Red corresponds to high flux, and blue is low. |
|
|
|
|
Potts model simulations have been extensively applied to recrystallization
problems as well. In these systems, boundary energy may be finite or zero, but
differences in volumetric free energy across the structure (due to stored strain
energy) tend to dominate Equation 1. Recrystallization occurs
as low energy nuclei grow into regions of high stored energy, as shown in Figure
5. For static recrystallization, Potts simulations corroborated the nucleation
and growth theory developed by Johnson and Mehl, Avrami, and Kolmogorov. The
position, location, and growth behavior of low energy nuclei were found to be
more important than other parameters, such as strain energy distribution, pinning
particles, and prior grain structure. For dynamic recrystallization, where theoretical
predictions are scarce, Potts simulations duplicated experimental results and
indicated some chaotic behavior.21
More recently, Potts simulations of dislocation cell (subgrain) evolution have
elucidated mechanisms for nucleation of strain free grains, which can initiate
the recrystallization process.35,36
Figure 6 shows a few other examples of
Potts model microstructures.
In addition to elucidating microstructural evolution processes, the Potts model can generate microstructures for use in subsequent simulations of materials behavior. This is particularly valuable in 3-D, where the Potts model can readily produce structures that would be difficult to extract from experimental micrographs. Figure 7 shows some typical materials response simulations performed on Potts model grain structures. In each case, the 3-D materials response cannot be extracted from two-dimensional systems, so the availability of realistic 3-D microstructures directly enables the response calculations.
Thanks to V. Tikare, T.E. Buchheit, and M.A. Miodownik for supplying figures for this paper. This work was performed at Sandia National Laboratories, supported by the U.S. Department of Energy under contract number DE-AC04-94AL8500, and by the Office of Basic Energy Sciences New Initiative program.
1. J.E. Burke
and D. Turnbull, Prog. Metal Phys., 3 (1952), p. 220.
2. R.L. Fullman, Metal Interfaces
(Cleveland, OH: ASM,
1952), p. 179.
3. M.P. Anderson et al., Acta
Metall., 32 (5) (1984), p. 783.
4. H. Frost, C.V. Thompson,
and D.T. Walton, Grain Growth in Polycrystalline Materials, ed. G. Abbruzzese
and P. Brosso (Brookfield, VT: Trans
Tech Publications, 1992), p. 543.
5. D. Weiare and J.P. Kermode,
Phil.
Mag. B, 48 (1983), p. 245.
6. L.-Q. Chen and Y.-Z. Wang,
JOM, 48 (11)
(1996), pp. 13–18.
7. D. Raabe, Grain
Growth in Polycrystalline Materials III, ed. H. Weiland, B.L. Adams,
and A.D. Rollett (Warrendale, PA: TMS, 1998),
p. 179.
8. K. Kawasaki, T. Nagai, and
K. Nakashima, Phil.
Mag. B, 60 (1989), p. 1399.
9. H.J. Frost and C.V. Thompson,
J. Electronic Mater.,
17 (5) (1988), p. 447.
10. V. Tikare et al., Acta
Mater., 47 (1) (1999), p. 363.
11. R.B. Potts, Proc. Camb.
Phil. Soc., 48 (1952), p. 106.
12. D.J. Srolovitz et al.,
Acta Metall., 32 (1984), p. 793.
13. D.J. Srolovitz et al.,
Acta
Metall., 32 (1984), p. 1429.
14. M.P. Anderson, G.S. Grest,
and D.J. Srolovitz, Phil.
Mag. B, 59 (3) (1989), p. 293.
15. E.A. Holm, D.J. Srolovitz,
and J.W. Cahn, Acta
Metall. Mater., 41 (4) (1993), p. 1119.
16. E.A. Holm and D.J. Srolovitz,
Morris E. Fine Symposium, ed. P.K. Liaw et al. (Warrendale, PA: TMS,
1991), p. 187.
17. E.A. Holm, N. Zacharopoulos,
and D.J. Srolovitz, Acta
Mater., 46 (3) (1998), p. 953.
18. M. Miodownik, J.W. Martin,
and A. Cerezo, Phil.
Mag. A, 79 (1999), p. 203.
19. M. Miodownik, E.A. Holm,
and G.N. Hassold, Scripta
Metall. Mater., 42 (12) (2000), p. 1173.
20. D.J. Srolovitz, G.S. Grest,
and M.P. Anderson, Acta
Metall., 34 (9) (1986), p. 1833.
21. A.D. Rollett, D.J. Srolovitz,
and M.P. Anderson, Acta
Metall., 37 (1989), p. 627.
22. V. Tikare and J.D. Cawley,
Acta
Mater., 46 (4) (1998), p. 1333.
23. P. Zhu and R.W. Smith,
Acta
Metall. Mater., 40 (4) (1992), p. 683.
24. G.N. Hassold, I.-W. Chen,
and D.J. Srolovitz, J.
Am. Ceram. Soc., 73 (10) (1990), p. 2857.
25. E.A. Holm et al., Phys.
Rev. A, 43 (6) (1991), p. 2662.
26. E.A. Holm, M.A. Miodownik,
and J.W. Cahn, In press, (2000).
27. A.D. Rollett and D. Raabe,
Comput. Mater. Sci., 21 (1) (2001), p. 69.
28. J.A. Glazier, M.P. Anderson,
and G.S. Grest, Phil.
Mag. B, 62 (1990), p. 615.
29. D. Raabe, Acta
Mater., 48 (2000), p. 1617.
30. G.N. Hassold and E.A. Holm,
Computers in Physics, 7 (1) (1993), p. 97.
31. H.V. Atkinson, Acta
Metall., 36 (3) (1988), p. 469.
32. E.A. Holm, G.N. Hassold,
and M.A. Miodownik, to appear in Acta
Mater.
33. G.S. Grest, D.J. Srolovitz,
and M.P. Anderson, Acta
Metall., 33 (3) (1985), p. 509.
34. D.C. Hinz and J.A. Szpunar,
Phys. Rev. B, 52 (1995),
p. 9900.
35. A.D. Rollett and E.A. Holm,
Recrystallization 96, ed. T.R. McNelley Monterey, CA: Monterey
Institute of Advanced Studies, (1996), p. 31.
36. M.A. Miodownik and E.A.
Holm, to appear in Proceedings of the First Joint International Conference
on Recrystallization and Grain Growth (New York: Springer
Verlag, 2001).
Elizabeth A. Holm is a primcipal member of the technical staff of the Materials and Process Modeling Department of Sandia National Laboratories. Corbett C. Battaile is also with Sandia National Laboratories.
For more information, contact E.A. Holm, Sandia National Laboratories, Materials and Process Modeling, Albuquerque, NM 87185-1411; (505) 844-7669; fax (505) 844-9781; e-mail eaholm@sandia.gov.
Direct questions about this or any other JOM page to jom@tms.org.
| If you would like to comment on the September 2001 issue of JOM, simply complete the JOM on-line critique form | |||||
|---|---|---|---|---|---|
| Search | TMS Document Center | Subscriptions | Other Hypertext Articles | JOM | TMS OnLine |