 |
47 (5) (1995), pp. 12-13. JOM is a publication of The Minerals, Metals & Materials Society |
|---|
<%=banner_getBannerHTML("1995 Salary Survey page",1,1)%>
The latest version of this article appears in the April 2004 issue of JOM. It can be purchased in portable document format (PDF) from the TMS Document Center. |
|---|
 |
47 (5) (1995), pp. 12-13. JOM is a publication of The Minerals, Metals & Materials Society |
|---|
Tammy M. Beazley
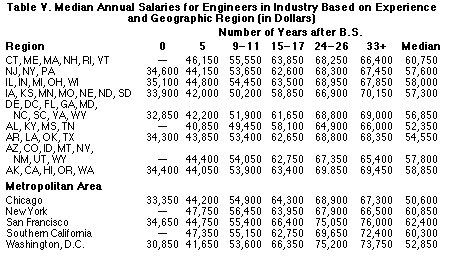
In an effort to report on salary trends over time, the American Association of Engineering Societies (AAES) Engineering Workforce Commission (EWC) compiles annual salary statistics of engineers employed in industry and government in the United States and biennial statistics for engineers in academia. The EWC gathers salary data from employers, who submit summaries of the base compensation of their engineers, classified by levels of experience, supervisory responsibility, and academic preparation. From these data, the commission also develops comparisons of salaries among different industrial sectors, geographical regions, and sizes of employers.
The survey does not provide data on specific engineering fields, such as civil or mechanical engineering. Instead, the survey reports statistics on all engineers employed in a certain industry (e.g., chemical) regardless of their educational background. (Obtaining the field of expertise for each engineer would increase the burden the survey places on participants to unacceptable levels.)
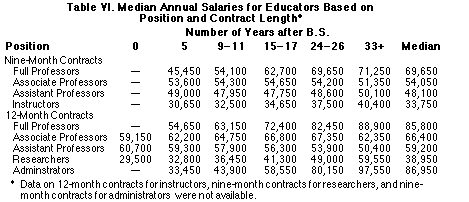
The survey data for 1994 are reported in three volumes—Professional Income of Engineers 1994, Engineers Salaries: Special Industry Report 1994, and Salaries of Engineers in Education. The first compiles salary information for engineers by sector and government area, responsibility, and geographic area. Engineers Salaries: Special Industry Report 1994 presents the data in more detail, grouping salaries by level of education within each sector, level of responsibility, and geographical area. It also provides a history of salaries in particular sectors since 1960. Salaries of Engineers in Education 1994 reports salaries of full-time faculty at engineering and engineering technology schools for nine- and 12-month contracts. Salaries are reported for six ranks: full professors, associate professors, assistant professors, instructors, researchers and other nonteaching staff, and administrators.
The data in this year's AAES survey represent 100,278 engineers from 236 private sector organizations; 7,857 engineers employed by 19 federal or state governmental agencies; and 13,446 engineers working in 234 colleges and universities throughout the United States. Table I categorizes participants according to their field of employment.
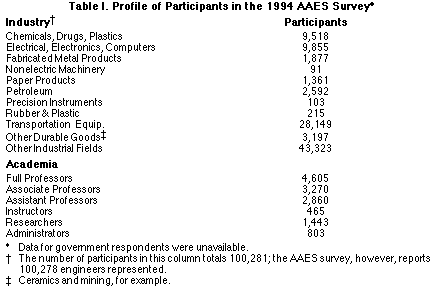
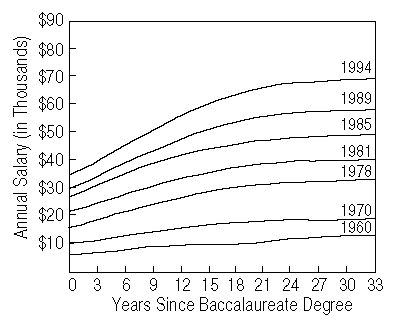
Figure 1 compares 1994 salaries of all engineers in all industries with that of all engineers in selected years back to 1960. Salaries rise after the first year of experience until 30 years of experience, at which time there is a clear leveling off.
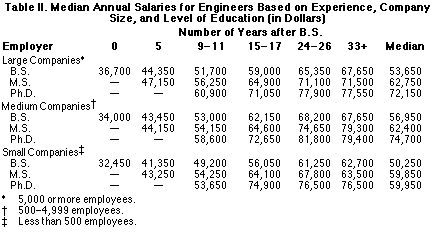
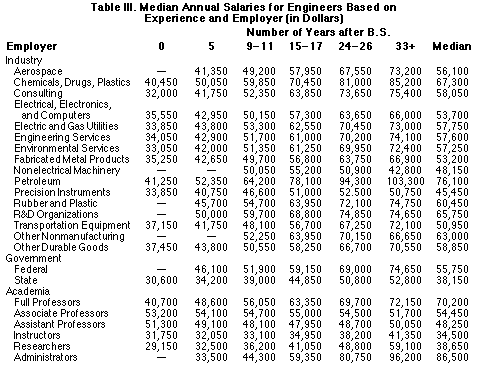
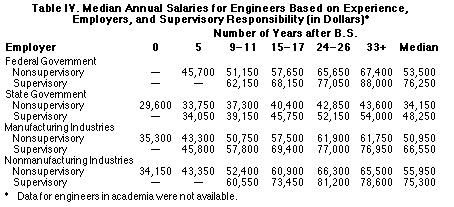
Supervisory positions in engineering (Table IV) showed slight increases and some declines from last year's salaries. Supervisors in state government suffered a $3,000 decline, while nonsupervisors in state government saw a $450 decline in median salary. On the other side of the spectrum, salaries for supervisory positions in federal government increased from a median salary of $65,050 in 1993 to $76,250 in 1994.
Tammy M. Beazley is a staff writer for JOM.
For more information on the survey or to order any of the volumes, contact the AAES, 1111 19th Street, N.W., Suite 608, Washington, D.C., 20036; telephone (202) 296-2237; fax (202) 296-1151.
Direct questions about this or any other JOM page to jom@tms.org.
| Search | TMS Document Center | Subscriptions | Other Hypertext Articles | JOM | TMS OnLine |
|---|