 |
50 (3) (1998), pp. 22-25, 49. |
|---|
|
50 (3) (1998), pp. 22-25, 49. |
|---|
Vacuum Arc Remelting QuickTime Clips | ||||
|---|---|---|---|---|
 |
 |
 |
 |
 |
 |
| CONTENTS |
|---|
Ingot defects may originate from several sources: foreign materials in the melt stock or electrode, drop-in material from the furnace interior, and solidification defects.1,2 To eliminate each of these, it is first necessary to characterize their features, understand formation mechanisms, and determine rates of formation or dissolution. Solidification defects in particular depend on the local solidification environment as well as thermal and compositional perturbations to the solidification zone. Process modeling3 strongly contributes to understanding defect formation because it can give important insights into thermal conditions within the ingot pool and at the solidification interface during steady-state and transient furnace operating conditions. Improved sensors and process controls4 can then be used to detect and avoid operating regimes that cause defects.
The Specialty Metals Processing Consortium (SMPC) has conducted a number of laboratory- and industrial-scale experiments to investigate defect formation and survival in nickel-based and titanium alloys. These experiments typically span a range of melting conditions and may include melt-rate transients in order to establish specific thermal conditions that produce the type of defect being studied. Process modeling is used as a tool to design the experiments to produce carefully controlled inputs. Ingots produced in the experiments are routinely sectioned and analyzed for pool shape, solidification structure, alloy chemistry distribution, and defect structure. These ingots can be large (up to 91 cm diameter), so a facility was developed at Sandia National Laboratories in Livermore, California, to map the chemistry of large ingot slices (up to 60 cm square and 140 kg) using x-ray fluorescence (XRF) analysis.5 This analyzer can map at both the macro- and microscale and has been extremely useful to quantify the effects of process variations on local alloy composition.5,6
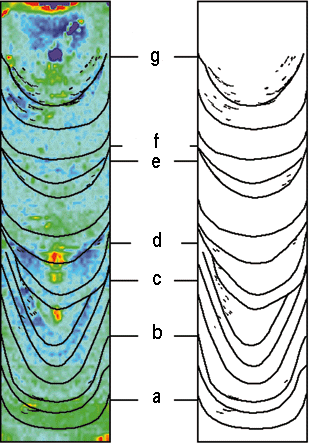
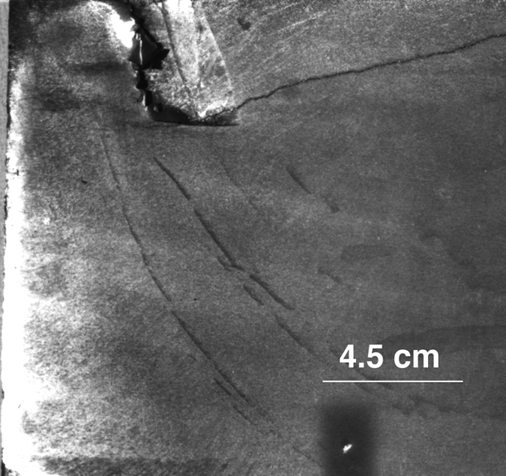
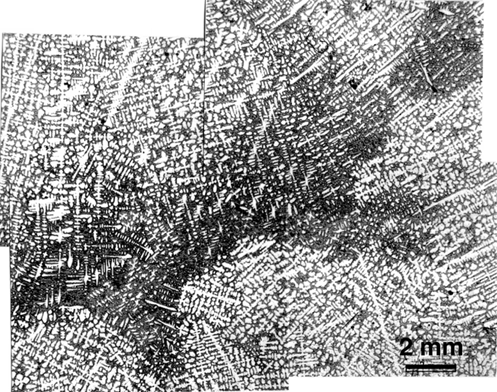
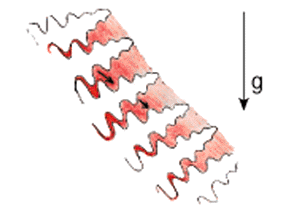
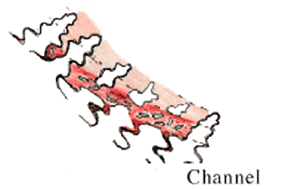
In VAR-melted alloy 718, channel-type freckles can form within the ingot and are most commonly found near mid-radius. An extreme example of this is shown in Figure 1, which is a longitudinal section through the center of a 52 cm diameter ingot produced under a very wide range of melt conditions. The figure contains maps of pool profiles, freckle locations, and niobium content. Freckles were formed under a variety of conditions. The upper left corner of the ingot is shown at low magnification in Figure 2a and at higher magnification in Figure 2b. At lower magnification, the defects are nearly aligned with the pool surface, but upon closer observation it is determined that the freckles actually lie at an angle somewhat more horizontal than the microstructural bands outlining the pool surface. Thus, the freckles can be concluded to actually grow in a downward direction. In the higher magnification micrograph, the freckle region contains a high concentration of niobium-containing solidification products.
An x-ray map of niobium from a region of a freckle is shown in Figure 3. As expected, the freckle region is enriched in niobium, but a depletion of niobium in the region above the freckle is also apparent. A line-trace analysis traversing the freckle is shown for niobium and chromium in Figure 4. The data were obtained using a beam size of 500 mm. The niobium content is increased from the nominal value of 5.3 wt.% to more than 11 wt.%. In the same region, the chromium content is decreased from its nominal value of 17.7 wt.% to a measured value of less than 16 wt.%. The niobium content is also slightly decreased, and the chromium content slightly increased in the region above the freckle. Channel-type defects form as a result of density changes in the liquid within the mushy zone resulting from elemental partitioning during solidification.
 |
 |
| a | b |
| Figure 2. (a) A low magnification macrograph of a line of freckles in the upper left section of alloy 718 ingot; and (b) a higher magnification view of the freckle microstructure. | |
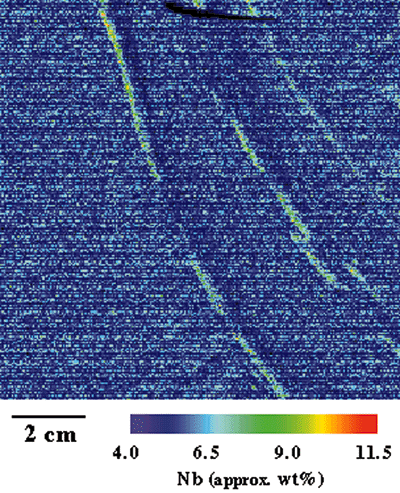 |
| Figure 3. A niobium map of the freckle region in alloy 718 ingot, 10 cm x 10 cm. |
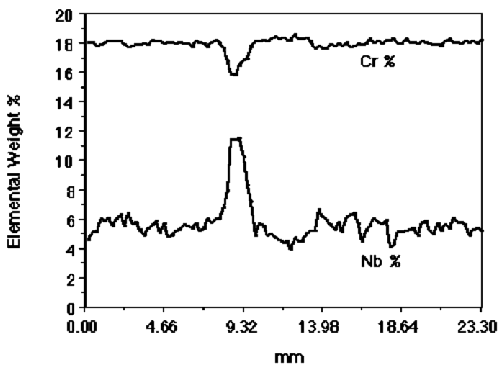 |
| Figure 4. A line trace of niobium concentra-tion across the freckle in alloy 718 ingot, showing a high concentration within the freckle region.5 |
Alloy 625 is another commonly processed nickel-based superalloy that has a lower niobium content than alloy 718 (3.5 wt.% vs. 5.5 wt.%). Freckles in ESR-melted alloy 625 do not form as channel-type defects at the ingot mid-radius, but instead form with a more globular morphology within the equiaxed solidified grains at or near the center of the ingot. A pair of SMPC experimental 56 cm ESR ingots were produced at Inco Alloys to investigate the range of melting conditions that could produce this variety of freckles and provide measured pool shapes for ESR model verification.3 Five melt rates were selected, and periodic melt transients were introduced as plunges in electrode-immersion depth, ranging from 1.24.8 mm. The ingots were sectioned and analyzed for solidification microstructure and composition using the XRF system.5
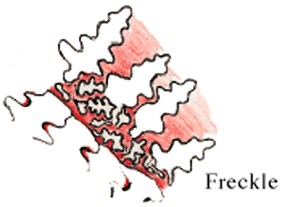
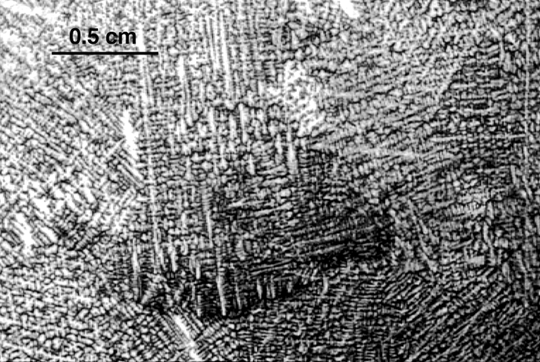
An example of an etched ingot is presented in Figure 6, which shows the full 56 cm ingot diameter in a segment melted at a rate that produces the equiaxed structure. Under this condition, approximately the center one-third of the ingot solidified as equiaxed dendrite colonies, while the outer areas solidified as a columnar dendritic structure. The equiaxed grains form within the low thermal gradient at the center of the ingot under these ESR melt conditions. In all of the ingot sections, freckles were observed only within the equiaxed solidified grain region. The etched freckle microstructure (Figure 7) shows a sharp interface at its bottom, with a diffuse transition at the top. Visually, the fairly subtle appearance of these freckles makes it difficult to accurately map their distribution. However, the freckle concentration was similar in all of the ingot equiaxed regions, independent of melting conditions. The extent of the equiaxed region increased with melt rate, as did the total number of freckles. Also, no observable pattern in freckle concentration could be associated with melt perturbations due to the electrode plunges.
 |
 |
| a | b |
 |
 |
| c | d |
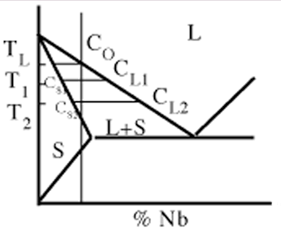
| Figure 5. The mechanism of freckle formation showing the sequence of the density-driven downward-forming channel to form a freckle. (a) An alloy 718 niobium pseudo-binary phase diagram. When liquid of CL2 is increased from T2 to T1, CS2 CS1 and CL2 CL1, (b) increased density of interdendritic liquid results in a downward flow, (c) channel defects form by a dissolution mechanism, and (d) the channel consists of a high-solute dendritic fragmented region. | |
Solidification in the equiaxed zone starts with the formation of grains ahead of the primary solidification front. They likely nucleate heterogeneously, possibly from dendrite fragments. As the dendrites grow, solute elements (niobium and molybdenum) are rejected to the liquid, some interdendritically and some to the surrounding liquid ahead of the dendrite tips. As the grains impinge and interlock, they will be surrounded by high-solute-content liquid. Shrinkage also occurs due to liquid/solid volume change. This liquid flow of enriched, higher-density liquid results in solute-enriched regions, primarily along grain boundaries, that eventually solidify into freckles. The primary cause of this type of defect is high process melt rates at large ingot diameters, which result in low thermal gradient conditions at the ingot center and cause the equiaxed solidification structure that is susceptible to this segregation defect. The results of the integrated experimental and computational modeling program are being used to provide the ability to predict the relationships between melt conditions, ingot microstructure, and the formation of melt-related defects.
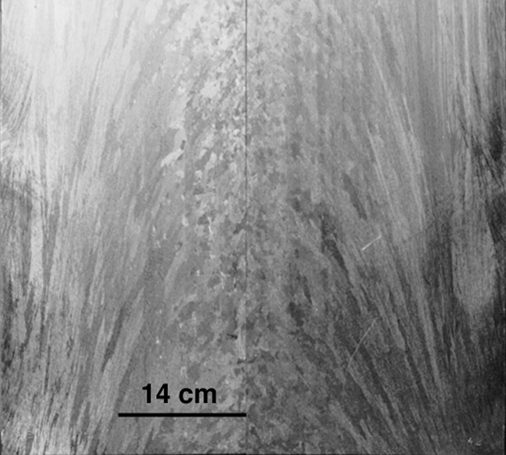 |
| Figure 6. An etched segment of 56 cm diameter ESR ingot of alloy 625 showing an equiaxed grain center region and surrounding columnar dendritic grains. |
 |
| Figure 7. A micrograph of an alloy 625 freckle within an ingot-equiaxed solidification zone. |
 |
| 8a |
 |
| 8b |
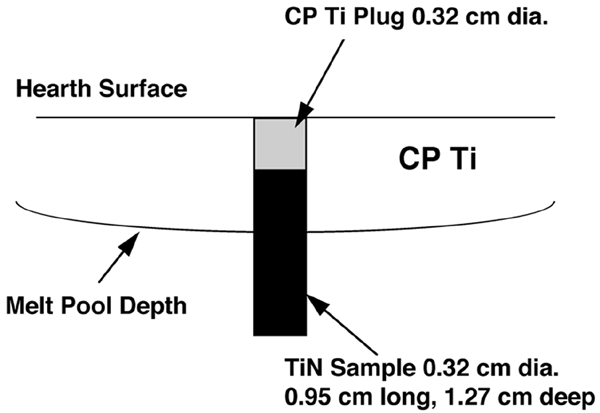
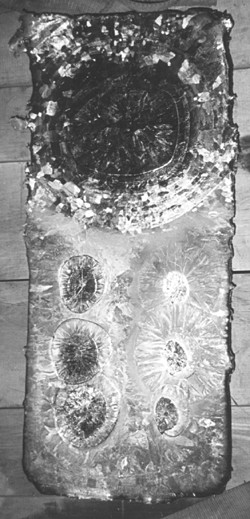
| Figure 8. (a) A schematic of a TiN dissolution specimen placed in an EB hearth surface and (b) the surface of the EB furnace hearth after six sample molten pool exposures. |
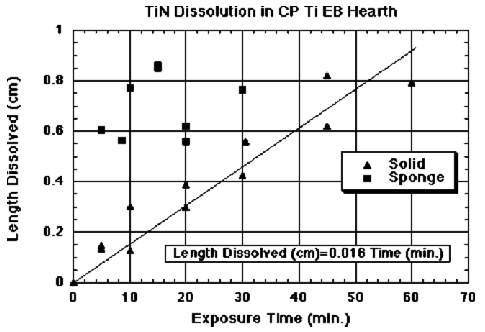 |
| Figure 9. Dissolution of solid TiN and 15% nitrogen titanium sponge in an EB furnace hearth. |
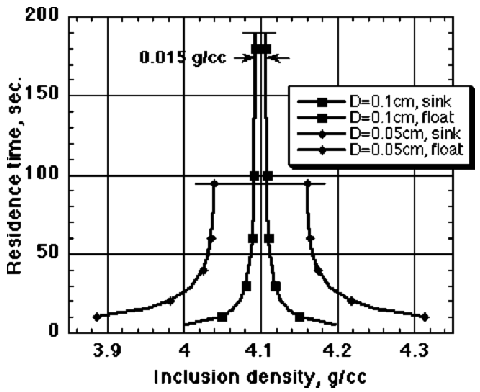 |
| Figure 10. The calculated survival times of TiN solid particles that are floating in molten titanium. |
To predict hard-alpha inclusion survival, it is necessary to understand the thermal environment the particle would see for each process as well as characterize particle-dissolution rates in the hearth or ingot environments. There has been work in both areas. Hearth thermal and fluid-flow modeling has been underway at Sandia, Massachusetts Institute of Technology, General Electric Aircraft Engines, by Ablitzer et al.,10 and Bellot et al.11 for EB, and at Concurrent Technologies Corporation for the PAM process. VAR models continue to be developed by the SMPC.3 Particle-dissolution rates have been measured by several direct approaches.12,13
Dissolution experiments by the SMPC have been conducted in the EB furnace at Sandia's Liquid Metal Processing Laboratory. Samples were either pure, fully dense titanium nitride or Timet-nitrided sponge (average 15 wt.% nitrogen). Rods of each material 0.95 cm long and 0.32 cm diameter were fabricated, inserted into holes drilled 1.3 cm deep into a commercially pure (CP) titanium hearth surface, and covered with a CP titanium plug (Figure 8a). A 2.5 cm defocused electron beam was switched over the rod location to melt in a small pool of titanium around the rod; samples were exposed for 560 minutes. The bottom of the rod remained fixed into the solid, and the top dissolved into molten titanium. An average of 1.5 kW was directed at each pool by applying a pulsed diffuse electron beam to the area. A post-test hearth surface with six samples is shown in Figure 8b. After exposure, each sample was cut out, and the nitride sample was metallographically sectioned in order to measure the remaining rod length. From this, the length dissolved was calculated.
The values of solid rod TiN dissolution length versus time exhibit an approximate linear relationship (Figure 9) with an average measured rate of 0.016 cm/min. Dissolution data for the nitrided sponge are much more erratic, but rates for the sponge rods are at least 50% higher than the solid nitride. Cross sections of the samples showed that the pool depths increased with exposure time due to heating of the hearth material, but the bottoms of all samples remained fixed in their drilled holes. The dissolving sample tops always remained a few millimeters above the liquid/solid interface, therefore it is likely that the temperature was just above the liquidus temperature of 1,670°C for CP titanium. Reddy13 measured a dissolution rate for TiN in Ti-6-4 of 0.004 cm/min. at 1,650°C under static pool conditions. In the present experiments, weak circulation was observed on the pool surface, which suggests the sample tips were continuously swept by flowing titanium. This would tend to remove nitrogen from the vicinity, lowering nitrogen activity at the particle boundary; this likely increased the dissolution rate relative to a static pool with diffusion-limited nitrogen transport. The cross sections showed that the sponge particles had varying amounts of porosity and nitrogen level from sample to sample; this contributed to the scatter in measured dissolution rates. For modeling calculations of particle survival, a conservative assumption is to use the lower rates measured for solid TiN.
Using these experimental values, survival of nitride particles in titanium has been modeled by Powell et al.12 as a function of particle density and diameter. The model assumes spherical shape and calculates terminal floating or sinking rates based on a balance of drag force with buoyancy force for the moving particle. Figure 10 shows calculated residence times of two size particles, 1 mm and 0.5 mm, for varying densities, assuming a hearth melt depth of 5 cm. Particles with near-neutral density survive the longest (190 seconds for a 1 mm particle); those significantly lighter or heavier quickly float up to the surface or sink to the bottom. Slow-moving particles remain suspended until they dissolve or pass out of the hearth. The analysis indicates that there is only a very narrow density range near neutral density where particles larger than 1 mm will remain suspended. With these estimates of survival times, the hearth-melt process can be designed to provide sufficient residence time to ensure the dissolution of particles up to a given size. Care must be taken to prevent a direct rapid flow path through the hearth, called short circuiting. Advanced models and experiments of flow-circulation patterns within the hearth as a function of electron-beam pattern or plasma-torch pattern will provide a more detailed description of particle trajectories and survival times.
In the VAR of titanium alloys, concerns for hard-alpha TiN particle survival are somewhat different. For alloys that are melted at high melt rates, such as Ti-6Al-4V, the ingot molten pool is very large with long solidification times.3 Likewise, for alloys melted at lower rates, such as Ti-17 or Ti-10V-2Fe-3Al, the pools are smaller, but solidification times are still many minutes. Near-neutral density particles with long rising or sinking times (which also can circulate with pool flows) will likely dissolve. Strongly floating particles are rapidly dissolved by arc superheat at the pool surface. Sinking particles, larger and higher density, are the major concern since they can rapidly fall to the pool bottom. Here they may not dissolve, because the alloy liquidus temperature is below the melting tem-perature of TiN or nitrogen-stabilized alpha titanium that may form by diffusion around the particle. For this reason, multiple VAR steps may be needed to remove the particles.
ABOUT THE AUTHORS
James A. Van Den Avyle earned his Ph.D. in metallurgical engineering at the Massachusetts Institute of Technology in 1975. He is currently a principal member of the technical staff at Sandia National Laboratories.
John A. Brooks earned his Ph.D. in metallurgy at Carnegie Mellon University in 1981. He is currently a principal member of the technical staff at Sandia National Laboratories. Dr. Brooks is also a member of TMS.
Adam C. Powell earned his Ph.D. in materials science and engineering from the Massachusetts Institute of Technology in 1997. He is currently a post-doctoral researcher in metallurgy at the National Institute of Standards and Technology. Dr. Powell is also a member of TMS.
For more information, contact J.A. Van Den Avyle, Sandia National Laboratories, MS 1134, Albuquerque, New Mexico 87175; (505) 845-3105; fax (505) 845-3430; e-mail javande@sandia.gov.
Direct questions about this or any other JOM page to jom@tms.org.
| Search | TMS Document Center | Subscriptions | Other Hypertext Articles | JOM | TMS OnLine |
|---|