 |
The following article is a component of the November 1998 (vol. 50, no. 11) JOM and is presented as JOM-e. Such articles appear exclusively on the web and do not have print equivalents.
|
Nondestructive Evaluation: Research Summary
Using Scanning Acoustic Microscopy to Study Subsurface Defects and Crack Propagation in Materials
Zayna M. Connor, Morris E. Fine, Jan D. Achenbach, and Mark E. Seniw
 |
|---|
| CONTENTS |
|---|
|
An investigation of fatigue crack generation and microcrack propagation in aluminum-alloy riveted lap joints was undertaken using scanning acoustic microscopy. The study illustrates the usefulness of scanning acoustic microscopy for studying cracks and pores that are hidden from view when using either optical or scanning electron microscopy.
The scanning acoustic microscope (SAM) is of particular interest for investigating subsurface features in materials such as pores and cracks.
The first acoustic microscopes were built in the early 1970s.1-4 Lemons and Quate3 developed the first SAM in 1974. Two kinds of acoustic microscopes are generally in use—point focus and line focus. SAMs are of the point focus variety. Here, a focused beam is scanned over and penetrates a specimen immersed in water; the depth of penetration depends on the acoustic frequency and material properties. With the SAM, interference fringes are eliminated because the acoustic energy is focused over a diameter of less than one wavelength, and the image is formed by scanning one point at a time.5 The microstructures of specimens prepared for metallographic examination can also be investigated using a SAM because different phases have different elastic constants.
The Lemons and Quate microscope3 employed a through-transmission approach and was used to image a 200-mesh copper electron microscope grid. With the through-transmission technique, one transducer sends the signal while another receives it. The SAM used in the work described here, however, uses the reflection technique, whereby a single transducer sends and receives the signal. This circumvents the problem of aligning two transducers.
The transducer is made of piezoelectric ZnO sandwiched between layers of gold; the lens is made of single-crystal sapphire or silicon, both of which have high velocities of sound as compared to the water couplant.4,5 The attenuation of acoustic waves is small in single-crystal sapphire and silicon, another reason for selecting these for the lens.6 An early SAM for detecting internal flaws in materials was developed by Gilmore et al.7 Their system uses broadband acoustic pulses with a center frequency in the range of 10-100 MHz and a single-crystal silicon acoustic lens.
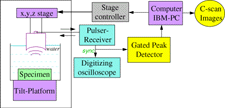 |
| Figure 1. A block diagram of the setup used for acoustic C-scan imaging. |
There are a great many applications of acoustic microscopy to the study of material properties and phenomena, and much material has been printed to overview the subject5,6,8-10 (the series Advances in Acoustic Microscopy, edited by Briggs, has been published annually since 1995). A particularly good article on detecting and measuring cracks in a variety of materials was written by Knauss et al.11
In research currently underway, we are using the SAM to investigate internal fatigue cracks in riveted aluminum alloy lap joints and pores in aluminum alloy castings.
A Panametrics Hyscan system in C-scan mode was used in conjunction with a focused transducer with a center frequency of approximately 50 MHz. A block diagram of the setup is shown in Figure 1. The specimens to be examined were submerged in a water tank. The focused transducer, made of single-crystal sapphire, was attached to an automated computer-controlled x-y-z stage and was excited by a Panametrics Pulser-Receiver (Model 5601A/ST) to generate ultrasonic waves. The focused beam was reflected by the specimen and returned to the transducer, which also acted as a receiver. The signal reflected from the back surface of the examined plate was gated, and its peak value provided the data for the C-scan image of this plate. The transducer output signals, digitized by a Tektronix TDS-540 four-channel digitizing oscilloscope and processed by a Panametrics Gated Peak Detector (Model 5608), were then acquired using a personal computer to produce a C-scan image. The signal reflected from the back surface of the plate with countersunk rivet holes was maximized, and then the transducer was defocused from the back surface to give the best image of the discontinuity. This signal was gated, and its peak value provided the data for the C-scan image.12 The through-thickness of the plate that contained cracks or pores was projected onto a surface.
 |
| Figure 2. Longitudinal and leaky surface waves are obtained by defocusing. |
The focused transducer used with the acoustic microscope has a narrow spot in the center of the spherical lens surface, which generates longitudinal waves at normal incidence and a narrow ring near the edge of the sphere, which generates leaky surface waves at the critical angle. Other positions on the spherical lens surface generate rays that are reflected at angles that either miss the transducer or hit it obliquely so that the response does not significantly contribute to the signal. The responses from both longitudinal and leaky surface waves are obtained by defocusing (i.e., moving the transducer closer to the surface of the object than the focal point—see Figure 2). As the transducer is moved closer to the surface of the specimen, the specular reflection from the center of the spherical lens and the leaky surface acoustic waves from the edge of the spherical lens interfere with each other destructively and constructively in cycles.6,13,14 Even if the transducer is extremely defocused, the resolution is not significantly affected, because the vast majority of the energy is localized at the center.6 In the research described here, the transducer was defocused for maximum constructive interference between the longitudinal and leaky surface waves.
The resolution of a microscope can be defined as the minimum size of a feature that can be determined. The resolution of the light microscope is determined by the equation:6

which is based on the Rayleigh criterion. The resolution of the reflection acoustic microscope is somewhat better than the resolution based on the Rayleigh criterion and is given by the equation6:

where N.A. is the numerical aperture and is equal to sin  o, which is the semi-angle subtended. The wavelength,
  o, is given by vo/f, where vo is the velocity of sound in the fluid, and f is the frequency.
The center frequency of the transducer used in these experiments is about 50 MHz. The velocity of sound is 1,496.7 m/s in distilled water, giving a wavelength 2.99 x 10⁻² mm. Estimating  o to be between 5° and 10° gives a resolution between 88 µm and 175 µm. From this, a conservative estimate of the resolution of the acoustic scans is between 90 µm to 180 µm.
 |
 |
| a |
b |
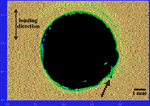
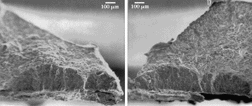
| Figure 3. (a) An early indication (shown by the arrow) of subsurface cracking as shown in a scanning acoustic micrograph. (b) The fracture surface of the specimen; multiple microcracks are seen on each side of the rivet hole. |
As the frequency increases, the resolution improves but the depth of penetration decreases; thus, a tradeoff exists between improved resolution and depth of penetration. The best obtainable resolution is determined by the depth of penetration desired. The desired depth of penetration coupled with a minimum pulse length enables determination of the highest usable frequency. These factors are thus used to determine the best resolution.15
In flush-head riveted lap joints that have been fatigue loaded, fatigue cracks initiate on the undersurface of the countersunk or outer panel. This is the crack-initiation location observed in aircraft outer panels. For this investigation, riveted lap-joint specimens were prepared by riveting together two
Alclad 2024-T3 aluminum alloy panels, one with three countersunk rivet holes and one with three straight holes. The rivet holes were drilled and countersunk using a computer-controlled machining center. The rivets were made of 2017-T4 aluminum alloy. The panels were riveted together using a manually operated hydraulic press, where the rivets were compressed between two flat plates at a constant load of five kN.
An MTS servohydraulic uniaxial fatigue testing machine with a rating of 100 kN was used to perform the experiments. Most of the three-rivet lap-joint specimens were loaded in uniaxial tension with an R ratio of 0.1 and a maximum load of 4.0 kN, which resulted in a nominal stress of 103 MPa. However, higher loads were used with some specimens to investigate the effect of load on the fatigue process. Shims were used in the grips so that the load axis was along the initial center line of the specimen. A saw-tooth wave with a frequency of 5 Hz was applied using a function generator; it was fine tuned with a digital recording oscilloscope. A positive R ratio was selected to prevent damage to the crack surface from crack closure.
 |
 |
| a |
b |
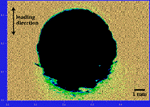
| Figure 4. (a) A SAM C-scan showing a subsurface crack on each side of the rivet. (b) The fracture surface of the specimen; a single subsurface macrocrack is seen on each side of the rivet hole. |
The subsurface fatigue cracks were examined with the SAM after selected numbers of cycles and were then returned to the fatigue apparatus for further cycling. Testing was discontinued and the specimens disassembled after identifying various stages of subsurface fatigue cracking. After disassembly, the panels containing the fatigue cracks were pulled in tension until fracture occurred so as to reveal the fatigue fracture surfaces that were examined microscopically. Analysis of a specimen fracture surface with a crack barely visible under the acoustic microscope revealed several crack initiation sites on each side of the rivet hole. Acoustic and electron micrographs of this specimen are shown in Figure 3.
Microcracks such as those shown in Figure 3b grow and link up to form a macrocrack on each side of the rivet. An example of a C-scan of a macrocrack can be seen in Figure 4a; the fracture surface is shown in Figure 4b.
 |
| a |
 |
| b |
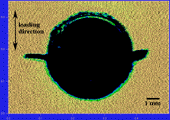
| Figure 5. SAM C-scans illustrating (a) an eyebrow crack formed when a maximum load of 4 kN is used and (b) a crack formed at a maximum load of 6 kN and located at three o'clock and nine o'clock around the rivet with respect to the stress direction. |
Crack-length measurements were made with the acoustic microscope both before and after the crack reached an external surface and with an optical microscope after the crack reached an external surface (found during periodic inspections during the course of the experiments). The acoustic scans revealed slow linear (dc/dN) growth while the cracks were subsurface; the crack growth rate increased rapidly when the crack broke through the surface. The surface crack lengths that were studied optically were consistently shorter than those identified with the acoustic microscope (showing that the crack is longer on the inner surface of the specimens—at least for lengths up to 15 µm).
When the maximum load was 4 kN, "eyebrow" cracks were initiated on the inner surface some distance from the rivet hole (Figure 5a); when the load was increased to 6 kN, the crack morphology changed to radial, located at three o'clock and nine o'clock around the rivet with respect to the stress direction (Figure 5b). At the higher load, the cracks initiated at the corner where the rivet hole intersects the hidden surface. Both crack types are seen in aircraft skins.
The SAM has thus been shown to be useful for quantitatively investigating subsurface fatigue cracks that cannot be observed either optically or with a scanning electron microscope. By combining the analytical techniques, however, the formation and growth of subsurface cracks may be quantitatively characterized in detail, revealing fatigue crack initiation sites and determining the crack profile and growth kinetics.
Porosity occurs in castings because of shrinkage during freezing and the decrease in solubility of dissolved gases as the metal goes from liquid to solid. Such pores are detrimental to the fatigue resistance of cast parts because of easier crack initiation. This has worked against the application of castings to critically loaded components, even though castings, especially near-net-shape ones, are less expensive than forged or machined parts. The reduction in fatigue life is related to the size of the pores and the distance of the pores from that part of the surface where applied stress is maximum.16 The extent of porosity varies in a casting from low where the casting began freezing to high in the last section of the metal to freeze. The fatigue life of the metal in the casting decreases along the solidification path.17 Thus, it is desirable to characterize the pores in castings. This is usually done by radiography. Recently, we were able to detect pores in permanent-mold castings of A356 aluminum alloy using the SAM (Figure 6). The pore indicated by the arrow was also observed by radiography. Deep surface features also reduce the intensity of the reflected acoustic waves, and research is best done with polished surfaces. The fiducial line seen in the figure is an example.
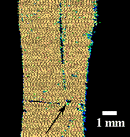 |
| Figure 6. A SAM C-scan of a pore (shown by the arrow) in a permanent-mold casting of A356 aluminum alloy. |
One of our long-range objectives is to follow the development and expansion of fatigue cracks from subsurface pores or inclusions using the SAM by periodically examining the specimen during the fatigue test. The presence of pores or other internal flaws has usually been modeled by assuming that a crack is present before the first cycle. This neglects the initiation process. Even though cracks initiate earlier at pores and inclusions, they are not cracks per se, and it is important to quantify the nucleation process as well as to obtain subsurface crack-propagation data to aid in the design of cast components.
This research was funded by a grant from the Federal Aviation Administration, a fellowship from the National Science Foundation, and an Amelia Earhart fellowship from Zonta International.
1. L.W. Kessler, P.R. Palermo, and A. Korpel, "Practical High Resolution Acoustic Microscopy," Acoustical Holography, vol. 4, ed. G. Wade (New York: Plenum Press, 1972), pp. 51-71.
2. J.A. Cunningham and C.F. Quate, "High-Resolution Acoustic Imaging by Contact Printing," Acoustical Holography, vol. 5, ed. P.S. Green (New York: Plenum Press, 1973), pp. 83-102.
3. R.A. Lemons and C.F. Quate, "Acoustic Microscope—Scanning Version," Applied Physics Letters, 24 (4) (February 15, 1974), pp. 163-165.
4. H.K. Wickramasinghe, "Scanning Acoustic Microscopy: A Review," J. Microscopy, 129, part 1 (January 1983), pp. 63-73.
5. C.F. Quate, A. Atalar, and H.K. Wickramasinghe, "Acoustic Microscopy with Mechanical Scanning—A Review," Proceedings of the IEEE, 67 (8) (August 1979), pp. 1092-1114.
6. A. Briggs, Acoustic Microscopy, ed. R. Brook et al. (Oxford, U.K.: Clarendon Press, 1992), p. 58.
7. R.S. Gilmore et al., "Acoustic Microscopy from 10 to 100 MHz for Industrial Applications," Phil. Trans. of the Royal Soc. of London A, 320 (1986), pp. 215-235.
8. M. Hoppe and J. Bereiter-Hahn, "Applications of Scanning Acoustic Microscopy–Survey and New Aspects," IEEE Trans. on Sonics and Ultrasonics, SU-32 (2) (March 1985), pp. 289-301.
9. G.A.D. Briggs et al., "Acoustic Microscopy of Old and New Materials," Acoustical Imaging, 17 (1989), pp. 1-16.
10. A. Briggs, ed., Advances in Acoustic Microscopy, vol. 1 (New York: Plenum Press, 1995).
11. D. Knauss et al., "Measuring Short Cracks by Time-Resolved Acoustic Microscopy," Advances in Acoustic Microscopy, vol. 1, ed. A. Briggs (New York: Plenum Press, 1995), pp. 49-77.
12. W. Li, J.D. Achenbach, and A. Cheng, "A Time-Resolved Line-Focus Acoustic Microscopy Technique for Surface-Breaking Crack Depth Determination," Review of Progress in Quantitative Nondestructive Evaluation, vol. 16B, ed. D.O. Thompson and D.E. Chimenti (New York: Plenum Press, 1997), pp. 1823-1830.
13. C.F. Quate, "Acoustic Microscopy," Physics Today, 38 (August 1985), pp. 34-42.
14. C.S. Tsai and C.C. Lee, "Nondestructive Imaging and Characterizations of Electronic Materials and Devices Using Scanning Acoustic Microscopy," Pattern Recognition and Acoustical Imaging, 768 (February 1987), pp. 260-266.
15. M. Hoppe and A. Thaer, "Scanning Acoustic Microscopy," Topics in Current Physics: Microscopic Methods in Metals, ed. U. Gonser (Berlin: Springer-Verlag, 1986), pp. 7-28.
16. M.E. Seniw et al., "Relation of Defect Size and Location to Fatigue Failure in Al Alloy A356 Cast Specimens" (Paper presented at the Paul C. Paris International Symposium on Fatigue of Materials, TMS-ASM Fall Meeting, Indianapolis, Indiana, 14-18 September 1997).
17. M.E. Seniw, J.G. Conley, and M.E. Fine, "The Effect of Microscopic Inclusion Locations and Silicon Segregation on Fatigue Lifetimes of Aluminum Alloy A356 Castings," submitted for publication to Materials Science and Engineering: A.
ABOUT THE AUTHORS
Zayna M. Connor earned her B.S. in metallurgical engineering at the University of Missouri-Rolla in 1993. She is currently a Ph.D. student in materials science and engineering at Northwestern University.
Morris E. Fine earned his Ph.D. in metallurgy from the University of Minnesota in 1943. He is currently an emeritus professor at Northwestern University. Dr. Fine is a member of TMS.
Jan D. Achenbach earned his Ph.D. from Stanford University in 1962. Dr. Achenbach is currently Walter P. Murphy and McCormick School Professor in the Departments of Civil Engineering and Mechanical Engineering at Northwestern University. He is also the director of the Center for Quality Engineering and Failure Prevention.
Mark E. Seniw manager of the Mechanical Behavior and Fatigue Facility at the Materials Research Center of Northwestern University.
For more information, contact M.E. Fine, Northwestern University, Center for Quality Engineering and Failure Prevention, 2225 N. Campus Drive, Evanston, Illinois 60208-3108; telephone (847) 491-4322; fax (847) 491-5227.
Copyright held by The Minerals, Metals & Materials Society, 1998
Direct questions about this or any other JOM page to jom@tms.org.


 o, which is the semi-angle subtended. The wavelength,
  o, is given by vo/f, where vo is the velocity of sound in the fluid, and f is the frequency.
 o to be between 5° and 10° gives a resolution between 88 µm and 175 µm. From this, a conservative estimate of the resolution of the acoustic scans is between 90 µm to 180 µm.


