 |
|
|---|
 |
|
|---|
 |
|---|
| TABLE OF CONTENTS |
A noninvasive x-ray technique was developed at the U.S. National Institute of Standards and Technology to monitor the solidification of single-crystal castings. X-ray energies of 150 keV to 320 keV have sufficient energy to perform transmission x-ray diffraction on a 17 mm thick nickel-alloy specimen. Laue diffraction images were obtained from the mold-encased casting even though the x-ray path (more than 1 m) through a directional-solidification furnace included a variety of intervening furnace components. The x-ray method was capable of sensing changes in the physical state of the casting (liquid or solid) and measuring the fraction of solid in the region of dendritic solidification.
Using XRD to study metal solidification and phase changes is not new.3–10 However, most of this research used very thin specimens (a few millimeters at most), furnaces with low attenuation x-ray windows (beryllium, graphite, or polyimide), and low x-ray energies (50 keV or lower). Work by Green11 extended XRD investigations to energies exceeding 150 keV. His flash XRD system also provided the facility for studying structural changes during dynamic events, such as crystal growth. Others, including Bechtoldt et al.,12 Kopinek et al.,13 Black et al.,14 and Reimers et al.,15 have employed high-energy XRD for studies of stress and texture in thick (up to 12.7 mm) steel specimens. For more detail on attentuation factors and XRD, refer to the sidebar Attentuation and XRD: A Primer.
At the National Institute of Standards and Technology (NIST), a technique based on transmission XRD was developed to study the solidification of a single-crystal turbine blade casting within its mold. High-energy x-rays (150–320 keV) penetrate through material surrounding the casting and produce a distinctive diffraction pattern that clearly indicates whether the sampled region is liquid or solid. A real-time transmission Laue x-ray image of the casting shows an ordered pattern of x-ray scattering (diffraction spots) from the solid and a diffuse ring of scattering from the liquid. The dramatically different spatial pattern provides a high-contrast, unequivocal spatial discrimination of the physical state of the alloy.
| ATTENUATION AND XRD: A PRIMER | |||||||||
|---|---|---|---|---|---|---|---|---|---|
| Attentuation Coefficients
Interactions of a narrow beam of monoenergetic x-rays with matter may be characterized with a total mass attenuation coefficient (µ/
where I is the transmitted x-ray intensity, I0 is the incident x-ray intensity, µ/
A linear attenuation coefficient (µ), defined as the product of the mass attenuation coefficient and the density, is useful for comparing the relative transmission through different materials of the same thickness. The reciprocal of the linear attenuation coefficient (material thickness that reduces the intensity to 1/e) is often used as a measure of the effective penetration depth for x-rays. Plots of 1/µ for several materials are shown in Figure A. Raising the x-ray energy increases transmission, because the attenuation coefficient decreases with energy.
The total mass attenuation coefficient may be expressed in terms of the sum of partial mass attenuation coefficients,16 which reveals the contributions by the photoelectric (PE), Compton (Comp), and coherent (coh) processes.
Plots of attenuation coefficients for nickel as a function of energy are shown in Figure B. The dominant interactions of x-rays with matter are the photoelectric process at low energies and Compton scattering at higher energies. Although coherent scattering (which gives rise to diffraction) is not a large contributor to the total attenuation, this interaction does occur at high energies.
X-Ray Diffraction
The XRD intensity of an unpolarized x-ray beam from a small crystal when the Bragg condition is satisfied may be calculated from the kinematical theory of diffraction.17 Although the absolute intensity is not measurable, the total diffracted energy (integrated intensity) can be measured. The total diffracted energy is given by17
where E is the total diffracted energy; I0 is the incident x-ray intensity;
The energy dependence of diffraction comes into Equation C through the energy-dependent atomic scattering factors (f),18,19 which are included in the structure-factor term FF*. The Lorentz-polarization factor term is also a function of x-ray energy, through the scattering angle 2
Often, a simple form of the diffraction conditions is used. The Bragg equation
where n is an integer,
Implications for High-Energy Transmission Diffraction
Probing the interior of a casting requires a transmission configuration. X-ray energies of more than 100 keV are needed to penetrate the refractory oxide mold (5–10 mm wall thickness) and casting specimen (1–20 mm thick).
Consider a beam of x-rays incident on a crystalline specimen contained within a casting mold (Figure D). The primary x-ray beam is attenuated as it passes through the mold wall and a portion of the specimen to a location where coherent scattering occurs. The scattered x-ray is attenuated along its exit path through the remaining specimen and exit mold wall. Attenuation losses along entrance and exit paths are minimized by raising the energy substantially above (5–20 keV) that used in conventional x-ray diffraction systems to 150–320 keV.
The dependence of the atomic-scattering factor for nickel was plotted in Figure C as a function of the scattering angle for several x-ray energies. At low x-ray energies, the atomic-scattering factor is quite large, even for large scattering angles. However, with high x-ray energies, f is significant only for small scattering angles (i.e., for a transmission geometry). In summary, low-energy (10–40 keV) x-rays are diffracted over wide angles, while high-energy (100–300 keV) x-rays diffract at narrow angles about the primary beam. For example, the scattering factor for nickel is 16.5 for 150 keV x-rays scattered at 3.5° from the direction of the incident x-ray beam (typical of our experimental geometry). The structure factor squared for this example is 16 x (16.5)2 or 4,356.
Because the irradiated volume (1 mm x 1 mm x 0.001 mm) contains many unit cells (for a nickel crystal va = 4.376 nm3), the ratio V/va is very large (2 x 10¹⁶). The large atomic-scattering factor in the forward direction and the enormous number of unit cells along the path of the primary beam (all with the same crystalline structure and orientation), in addition to the substantial intensity of high-energy x-rays that penetrate through a mold and specimen, account for the efficiency of high-energy transmission diffraction. |
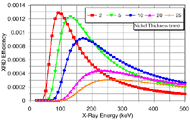
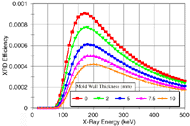
Figure 1a shows plots of the model-predicted efficiency of diffraction for a nickel specimen. The efficiency of transmission XRD is a strong function of both the specimen thickness and the incident x-ray energy. The broad peaks in the plots indicate an optimal range (100–275 keV) of x-ray energies for transmission XRD on these nickel specimens. The optimum energy yields the highest intensity of diffracted x-rays, which are able to penetrate through the specimen.
 |
 |
| a | b |
| Figure 1. Plots of model-generated XRD efficiency from (a) a nickel specimen at thicknesses of 2–25 mm and (b) a nickel specimen 10 mm thick surrounded by mold material. | |
Anticipating that the XRD technique would be used to probe the "mushy" zone (area of dendritic solidification containing both solid and molten material) of a casting, a specimen volume containing both liquid and solid was modeled. The liquid portion of the specimen was assumed to attenuate the incident and diffracted x-ray beams. The correct (lower) density of the liquid was used. The solid portion of the specimen attenuated both the incident and scattered x-rays as well and produced coherent scatter. A 6 mm thick section of N5 nickel-alloy casting was modeled, with various fractions of the thickness being composed of molten metal and crystalline solid. Energies from 20–500 keV were considered. The relationship between XRD efficiency and fraction of solid departed only slightly from a linear one. The curve had a slightly concave shape due to differences between the densities of the liquid and solid.
| THE HIGH-ENERGY TRANSMISSION DIFFRACTION APPARATUS | ||
|---|---|---|
| Figure E illustrates the key elements in the apparatus used for transmission XRD measurements. The x-ray tube produces a high-intensity, polychromatic source of x-rays restricted by collimators to a small circular beam. A fraction of the x-rays interacting with the sample is diffracted. An x-ray imager detects the x-ray pattern incident on its two-dimensionally sensitive area; an energy-sensitive detector may be used in place of the imager to measure the spectra of the primary and diffracted x-rays.
The choice of x-ray source diameter (focal spot size) of 1.2 mm or 4 mm (320 kV tubehead), or 0.2 mm or 3 mm (160 kV tubehead) was selected by activating one of the two filaments in the tube. The small (1.2 mm) focal spot size of the 320 kV tubehead proved most useful because its size corresponds to the diameter (1 mm) of the collimating apertures. Controls on the constant-potential x-ray generator permitted x-ray tube voltages to be varied between 15 kV and 320 kV. A tube current of 3 mA was possible at 320 kV. For some experiments, a means for reducing the x-ray source intensity was required so the diffraction signals did not overwhelm the detector system. A lower intensity was obtained by modifying the controller. Tube currents as low as 0.05 mA with incremental changes of 0.05 mA were possible. A beam-restricting collimator for the x-ray source was designed and fabricated. A triple-aperture design was employed to minimize beam divergence and optimize x-ray intensity.21 Interchangeable sets of 9 mm thick lead disks could be used to select beam diameters of 0.3 mm, 1 mm, 1.5 mm, or 2 mm. An alignment laser, placed in an opening in the base of the collimator, projected a visible beam along the same path as that of the x-ray beam. This permitted fast, safe, and simple alignment of the beam-stop and specimen. The primary beam transmitted through the specimen is often of high intensity. Blocking this beam from the detector improves the contrast of images and prevents an energy-sensitive detector from being overwhelmed by high count rates. A small tungsten rod (4 mm diameter and 6 mm thick) was positioned in the center of the primary x-ray beam emerging from the specimen to act as a beamstop. X-rays diffracted from the sample passed to the sides of the beamstop and were imaged, while the undiffracted primary beam was severely attenuated. The tungsten disk was suspended by a thin graphite/epoxy composite support. The low attenuation in the composite minimized the shadow it cast on the x-ray images. A real-time x-ray imager, designed specifically for XRD, was used for all experiments reported here. The scintillator screen was optically coupled to an image intensifier, which was then coupled to a charge-coupled device (CCD) camera sensitive to low-light levels. Fiber-optic coupling between the scintillator, image intensifier, and CCD camera transferred light very efficiently. The field of view of the imager was approximately 40 mm wide by 30 mm high. The imager was originally equipped with a 70 µm thick gadolinium-oxysulfide scintillator. The imager efficiency for high-energy x-rays was improved considerably by replacing the gadolinium-oxysulfide scintillator with a 6 mm thick fiber-optic glass scintillator. The fiber-optic scintillator produces an extremely low lateral spread of light and high-efficiency light transfer to the image intensifier. The glass scintillator also absorbed a much greater number of x-ray photons than the gadolinium oxysulfide, particularly at high energies. Acquisition and storage of the video frames from the PAL-format imager was performed with an eight-bit, monochrome frame grabber installed in a personal computer. A coprocessor board, connected to the frame grabber, speeded image manipulations and frame averaging (to increase signal-to-noise ratio). Frame averaging could be performed at a rate of 25 frames per second. Image acquisition and processing software provided the ability to perform dynamic-range expansion and compression, image averaging, and image subtraction, as well as image filtering to enhance the acquired images. A multiformat video cassette recorder was used to record radiographic and diffraction images during all experiments. The video tape served as a backup for direct image acquisition with the frame grabber and was useful in cases where the image was rapidly changing (e.g., dynamic events such as mold filling). Video frames could be digitized after the experiments by replaying the video tape through the frame grabber. |
A melting and recrystallization experiment was performed on an aluminum specimen in the gradient furnace. A 22 mm diameter, coarse-grained, polycrystalline, 99.999 percent pure aluminum rod in a quartz tube (2.2 mm wall thickness, 27 mm inner diameter), was placed in the furnace. Figure 4 shows the transmission Laue XRD patterns obtained during heating, melting, and resolidification of the aluminum.
As the rod was heated, the diffraction pattern changed, reflecting changes in the physical state of the specimen. The complex diffraction patterns in the first few frames of the image sequence were the result of interactions of x-rays with many crystals in the polycrystalline specimen. As the temperature was raised, the larger grains in the polycrystalline rod grew at the expense of the smaller ones (Ostwald ripening), and the diffraction pattern became simpler as the x-ray beam encountered fewer, but larger, crystals. Near the melting point (652°C), the diffraction pattern began to lose order. The Laue spot pattern degenerated into a diffuse ring of scattering when the aluminum was fully melted. The difference between the patterns produced by the solid aluminum and the liquid aluminum was dramatic and unmistakable. The Laue diffraction spots disappeared at the same time the diffuse ring formed. As the aluminum cooled below the melting point, the diffraction spots reappeared at the same time that the diffuse ring disappeared. The diffraction pattern for the resolidified aluminum specimen was simple, indicating an x-ray path encountering a few, large grains.
A resistively heated directional-solidification (DS) furnace (Figure 5) was used in the next set of experiments. The vacuum furnace was capable of producing 1,700°C temperatures. The x-ray source (A) and collimator (B) are on the right. The small-diameter x-ray beam passes through a borosilicate glass port 10 mm thick into the furnace. The beam then encounters molybdenum resistance-heater windings (D) (1.6 mm diameter). The wire is wound on an aluminum-oxide support tube (E) (100 mm internal diameter, 4.5 mm wall thickness). After passing through the coil support, the x-ray beam enters the casting mold (F) (6.4 mm wall thickness).
The cavity of the mold for the first melting experiment was 6 mm thick by 38 mm wide (producing a thin rectangular bar). The exit path for the x-rays, after diffraction from the specimen, was through 6.4 mm of mold, 4.5 mm of alumina, 1.6 mm of molybdenum, and 10 mm of glass. The real-time x-ray imager (G) was positioned outside the glass port to intercept the diffracted x-rays. The specimen was 780 mm from the x-ray source and 400 mm from the imager. The asymmetry in the location of the hot zone of the furnace within the bell jar was advantageous for placing the imager nearest the specimen. This shorter distance, from specimen to imager, yielded a larger angular field of view.
The x-ray source and imager were each attached to two-axis motion stages. The source and imager could be scanned in unison (horizontally and/or vertically) to probe different regions of the casting; however, by leaving the x-ray source fixed and scanning the imager, a large virtual field of view was achieved. The system was capable of moving the 130 kg x-ray tubehead in submillimeter increments and at speeds more than sufficient for following the liquid-solid boundary in a DS casting.
An early test, with no specimen in the furnace, disclosed that the primary x-ray beam intensity at the imager was not high enough to damage the imager. Therefore, no beamstop was required in these diffraction experiments. The large bright spot visible in many of the XRD images from furnace experiments is the primary x-ray beam.
Enclosures to provide radiation shielding were fabricated from 16 mm thick steel around the x-ray tube and 9.5 mm thick steel around the x-ray imager. Additional shielding was provided by lining the enclosures with lead sheet. Radiation surveys near the furnace indicated that the researchers could safely occupy areas near the furnace during operation of the XRD system.
During casting experiments, a metal alloy charge is placed in the crucible of the mold. After a 1 Pa vacuum has been established, the gate valve is opened, and the ram raises the mold into the hot zone of the furnace. The alloy melts, filling the mold. Solidification of polycrystals initiates at the base of the mold in the starter block where the alloy contacts the water-cooled ram. The fastest-growing grain reaches the grain selector (a corkscrew-shaped section of the mold) first and blocks growth of all other crystals with differing orientation. If the thermal conditions are correct, growth of a single-crystal continues upward in the mold as the mold is slowly withdrawn (150 mm/h) vertically from the furnace. Polished and etched sections of the completed castings showed a dendritic structure with several phases and an absence of grain boundaries.
Initial experiments with the DS furnace indicated that the region of solidification in the casting was beneath the field of view of the XRD sensor. The hot zone of the furnace had to be turned off after melting occurred to drive the solidification upward into the region probed by the sensor. To correct this problem, we rearranged components in the furnace and added new elements.
The hot zone (alumina core with molybdenum windings) of the furnace sat directly on the chill plate. Solidification occurred at the location of the chill plate or below it. This area is inaccessible for XRD because of the locations of the diffusion pump inlet, the chill plate, and its cooling coils. A 60 mm thick piece of alumina foam was used as a spacer between the chill plate and the hot zone (Figure 7). The foam has a structural rigidity sufficient to support the hot zone, but a density (240 kg · m–3) low enough to provide a path of low x-ray attenuation, free of interfering structures. At the same time the foam spacer was added, the chill coils were raised slightly to preserve the high-temperature gradient in the furnace, which drives solidification in the vertical direction. The borosilicate glass ports on the bell jar were replaced by graphite-epoxy ports. Less of the incident and diffracted x-ray beams are attenuated in the ports, yielding a higher diffraction spot brightness. X-ray transmission improved by a factor of 1.5 compared to the configuration with the glass ports.
The alignment of the crystalline planes in the casting can vary rotationally about the axis of the casting and can deviate from the vertical axis. A means for orienting the probing x-ray beam to obtain strong diffraction spots was devised. The vertical ram of the furnace was altered to permit rotation of the mold (and specimen). The rotation allowed us to position the solidifying metal such that the Bragg condition was satisfied for particular lattice planes and diffraction spots could be observed. After the specimen-rotation capability was added to the furnace, strong diffraction patterns from the crystalline alloy castings could be obtained during every experiment.
A previously cast single crystal of N5 alloy 6 mm thick in a mold of 5 mm wall thickness was placed in the unheated DS furnace. Figure 8 shows the XRD image recorded for this experiment. A gray level profile through the primary beam and one of the diffraction spots is also shown. After the image was acquired, the x-ray imager was replaced with the energy-sensitive germanium detector. As mentioned earlier, XRD is manifested spatially as spots or as peaks in the transmission energy spectrum. A lead collimator (25 mm thick, 3.5 mm diameter hole) was affixed to the germanium detector to permit probing small areas of the XRD field.
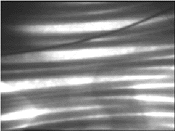
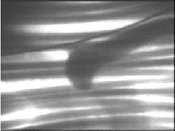
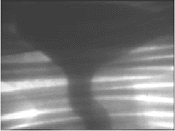
By removing the collimator of the x-ray source, a radiographic image of the mold could be formed, with an approximately 30 mm field of view. X-ray technique factors of 180 kV and 1 mA produced acceptable images of the casting within the hot zone of the furnace. Figure 10 shows the grain selector of the bar mold before any N5 had melted, the grain selector with a few drops of molten N5 at its top, and the grain selector immediately after it had been filled with molten N5 alloy. Filling the remainder of the mold with molten N5 was radiographically observed. After all of the N5 had melted, the furnace ram was used to slowly withdraw the mold through the temperature gradient established between the hot zone and the chill plate in the furnace.
The x-ray beam and imager were then positioned (using the remotely controlled motion stages) in the region of the alumina-foam spacer beneath the hot zone. We waited until the casting had withdrawn to the point where the x-ray beam was centered in the funnel-shaped area of the casting, just above the grain selector. The collimator was placed on the x-ray source to configure the system to observe XRD, and the tube potential and current were raised to 320 kV and 3 mA.
 |
 |
 |
| a | b | c |
| Figure 10. Radiographic images of the grain selector of the bar mold (a) before, (b) during, and (c) after filling with molten N5 alloy. | ||
The single-crystal structure in a casting could be confirmed by spatially scanning the x-ray source and imager. If the diffraction pattern remained the same, the region scanned possessed a single-crystal structure. After confirming the crystal structure of a solidified portion of the casting, the x-ray source and imager were scanned vertically from the crystalline (solid) region through the region of dendritic solidification into a fully molten region of the casting. During the scan, the XRD spot intensity decreased.
The measured gray level of a transmission diffraction spot from a typical experiment where the x-ray beam was scanned vertically in the casting is plotted in Figure 11 along with a model (Lever) prediction of the fraction of solid versus temperature for N5 alloy. Since the temperature profile in the casting was not measurable in this experiment, we have adjusted the vertical and horizontal scale of the XRD data to coincide with the solidification model predictions. It is encouraging that the shape of the modeled and experimental curves are similar. The experimental data also appear to show the formation of the predicted second phase (break in the curve).
A topograph is an image formed by the specular reflection of x-rays from crystalline planes; Figure 13 shows the geometry of topography. Reflections occur from lattice planes in correctly aligned dendrites. There are no reflections from the amorphous liquid surrounding the dendrites. As can be seen from the figure, there is a vertical exaggeration of the actual structure in the topograph. Additionally, there is a vertical enlargement due to divergence of the collimated x-ray beam. The horizontal enlargement of structure in the topograph is caused solely by divergence of the x-ray beam.
 from the transmission XRD images and the energy of the diffracted x-rays with the energy-sensitive detector were measured. Thus, knowing the wavelength and scattering angle, the lattice plane spacing can be calculated. Since the specimen material and its crystal structure are known, indexing a particular XRD spot is straightforward. During several casting experiments, a change in the XRD pattern was observed as the x-ray sensor was scanned about the casting. This was a clear indication of a change in crystal orientation, which was confirmed after the experiment by etching the completed casting.
References
1. J.R. Helliwell et al., "Instrumentation for Laue Diffraction," Rev. Sci. Instr., 60 (7) (1989), pp. 1531–1536.
2. I.J. Clifton, M. Elder, and J. Hajdu, "Experimental Strategies in Laue Crystallography," J. Appl. Cryst., 24 (1991), pp. 267–277.
3. K. Harris, G.L. Erickson, and R.E. Schwer, "Directionally-Solidification and Single-Crystal Superalloys" Specialty Steels and Heat-Resistant Alloys (1982), pp. 995-1006.
4. R.E. Green, Jr., "An Electro-Optical X-Ray Diffraction System for Grain Boundary Migration Measurements at Temperature," Advances in X-Ray Analysis, vol. 15 (New York: Plenum Pub., 1972).
5. S.E. Doyle et al., "Probing the Structure of Solids in a Liquid Environment: A Recent In-Situ Crystallization Experiment Using High Energy Wavelength Scanning," J. Crys. Growth, 112 (1991), pp. 302–307.
6. N.R. Joshi and R.E. Green, Jr., "Continuous X-Ray Diffraction Measurement of Lattice Rotation during Tensile Deformation of Aluminum Crystals," J. Matls. Sci., 15 (1980), pp. 729–738.
7. O. Babushkin et al., "A High-Temperature Graphite Furnace for X-Ray Powder Diffraction," Meas. Sci. & Tech., 4 (1993), pp. 816–819.
8. K.G. Abdulvakhidov and M.F. Kupriyanov, "High-Temperature Unit for X-Ray Diffraction Studies of Single Crystals," Instr. & Exptl. Tech., 35 (5) (1992), pp. 942–943.
9. H.L. Bhat et al., "A Furnace for In-Situ Synchrotron Laue Diffraction and Its Application to Studies of Solid-State Phase Transformations," J. Appl. Cryst., 23 (1990), pp. 545–549.
10. S. Hosokawa, S. Yamada, and K. Tamura, "X-Ray Diffraction Measurements for Expanded Liquid Alkali Halides at Very High Temperature," J. Noncrys. Solids, 15 (1992), pp. 40–43.
11. R.E. Green, Jr., "Applications of Flash X-Ray Diffraction Systems to Materials Testing," Proc Flash Rad. Symp., ASNT Fall Conf. (1977) pp. 151–164.
12. C.J. Bechtoldt et al., "X-Ray Residual Stress Mapping in Industrial Materials by Energy Dispersive Diffractometry," Advances in X-Ray Analysis, vol. 25 (New York: Plenum Pub., 1981), pp. 329–338.
13. H.J. Kopinek, H.H. Otten, and H.J. Bunge, "On-Line Measuring of Technological Data of Cold and Hot Rolled Steel Strips by a Fixed Angle Texture Analyzer," Proc. 3rd International Symposium on Nondestructive Materials Characterization (New York: Plenum Pub., 1989), pp. 750-762.
14. R.D. Black et al., "Three Dimensional Strain Measurements with X-Ray Energy Dispersive Spectroscopy," J. Nondestr. Eval., 5 (1) (1985), pp. 21–25.
15. W. Riemers et al., "Evaluation of Residual Stresses in the Bulk of Materials by High Energy Synchrotron Diffraction," J. Nondestr. Eval., 17 (3) (1998).
16. J.H. Hubbell, H.M. Gerstenberg, and E.B. Saloman, Bibliography of Photon Total Cross Section (Attenuation Coefficient) Measurements 10 eV to 13.5 GeV, Internal Report NBSIR #86-3461 (Washington, D.C.: NBS, 1986).
17. B.E. Warren, X-Ray Diffraction (New York: 1990).
18. C.T. Chantler, "Theoretical Form Factor, Attenuation, and Scattering Tabulation for Z = 1–92 from E = 1–10 eV to E = 0.4–1.0 MeV," J. Phys. Chem. Ref. Data, 24 (1995), pp. 71–111.
19. D. Waasmaier and A. Kirfel, "New Analytical Scattering Factor Functions for Free Atoms and Ions," Acta Crystallogr. A, 151 (3) (1995), pp. 416-430.
20. M.J. Berger and J.H. Hubbell, XCOM: Photon Cross-Sections on a Personal Computer, Internal Report NBSIR #87-3567 (Washington, D.C.: NBS, 1987).
21. B.D. Cullity, Elements of X-Ray Diffraction, 2nd ed. (Publisher’s City: Addison Wesley, 1978), pp. 156–158
22. T.A. Campbell and J.N. Koster, "Visualization of Liquid-Solid Interface Morphologies in Gallium Subject to Natural Convection," J. Crys. Growth, 140 (1994), pp. 414–425.
23. L.H. Schwartz and J.B. Cohen, Diffraction from Materials, 2nd ed. (Berlin: Springer-Verlag, 1987).
D.W. Fitting, W.P. Dubé, and T.A. Siewert are employed at the Materials Science and Engineering Laboratory, Materials Reliability Division, National Institute of Standards and Technology.
For more information, contact T.A. Siewert, NIST, 325 Broadway, Boulder, Colorado, 80303; (303) 497-3523; e-mail siewert@nist.gov.
Direct questions about this or any other JOM page to jom@tms.org.
| Search | TMS Document Center | Subscriptions | Other Hypertext Articles | JOM | TMS OnLine |
|---|