 |
http://www.tms.org/pubs/journals/JOM/9908/Atkinson/Atkinson-9908.html
|
 |
http://www.tms.org/pubs/journals/JOM/9908/Atkinson/Atkinson-9908.html
|
 |
|---|
| TABLE OF CONTENTS |
A number of atomistic-scale simulation techniques exist that could potentially be used as the basis for predicting microstructural evolution. These include molecular dynamics and energy minimization, both of which have been highly successful in predicting energetics and structures in metals, ceramics, and semiconductors. Unfortunately, present computational facilities are not nearly sufficient to allow these methods to become routinely useful predictive tools on scales required for microstructural length and growth times. Monte Carlo (MC) techniques present a tempting alternative since each calculation is concerned with a new configuration. Between each step, an atom is moved to a new position or, possibly, a pair of atoms are swapped. The total energy of this new configuration is then calculated and compared with the energy of the old configuration. On this basis, a decision is made as to whether the system should be updated to the new configuration or remain unaltered. However, even this method becomes computationally challenging when the number of atoms reaches the point necessary to model microstructural evolution. As such, we have implemented an MC-related methodology based on cellular automata (CA).
 |
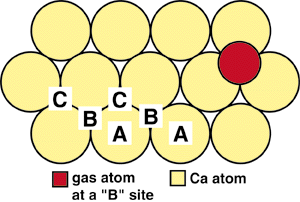
| Figure 1. The crystallographic structure of calcium. |
 |
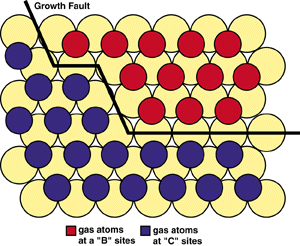
| Figure 2. The evolution of a gas-atom layer in calcium. |
As a first step toward implementing a CA model to describe microstructural evolution, this article describes the results of work to develop a simple atomistic simulation of a two-dimensional system comprising a layer of argon-gas atoms on a calcium (111) surface. The simulation results in the formation and growth of domains, with the domain size increasing as a function of simulation temperature. Previous results1 revealed that domain size increases as a function of flux of atoms incident on the surface. However, for the results presented here, the flux rate was held constant at eight percent.
If we examine the (111) surface more closely, it is clear that the distance between an interstitial B site and a nearest neighbor C site is rather short. Indeed, the gas atom in Figure 1 overlaps considerably onto the C site. As such, if a gas atom resides in a B site, it is not possible for a second gas atom to occupy a nearest-neighbor C site due to steric hindrance. It is important to realize that this is true only because of the specific matching of the size of the calcium (111) surface to the size of the argon atoms.
When the first few gas atoms impinge on the surface in the evolution of a gas-atom layer, they may reside in either B or C sites. As more atoms collect, patches or islands of B- and C-type atoms form. The distance between two neighbor B-type gas atoms (i.e., in next-nearest-neighbor sites) is the same as between two C-type gas atoms (Figure 2). However, the distance between allowed, non-hindered B- and C-type atoms is greater (i.e., between third or fourth neighbors). This results in a surface area with a lower density of gas atoms, termed a growth fault. In three dimensions, this would give rise to a stacking fault. Faults are important to the stability of a gas atom on the surface since the interaction energy of gas atoms is lower when they interact over longer distances. Therefore, atoms adjacent to growth faults have lower energy. This is the driving force that results in the formation and growth of islands of gas atoms that occupy only one type of site.
| METHODOLOGY |
|---|
| Interaction Energy of an Ar Atom with a Specific Surface Site
In this study, two types of interactions are considered:
where a and b are constants specific to the atoms i and j. For each potential type, the constant b corresponds to the van der Waals interaction, and the a constant is the electron-cloud repulsion. Details of how the parameters were derived are given in Reference 1. Using these potentials, it is possible to calculate the interaction energies that define the stability of an argon atom at a specific site on the surface. With calcium atoms located in the A sites of the f.c.c. lattice, argon atoms are prescribed to sit in the ideal B- and C-crystallographic f.c.c. sites. Hence, the interaction energy, EAr,Ca, between an argon atom and the calcium substrate is given by
where R = rAr + rCa, the sum of the argon and calcium atom radii, respectively. The interaction energy between two argon atoms on the surface is given by
where R = 2rCa. It should be remembered that the separation of the gas atoms is defined by the substrate. To simplify the analysis further, for each surface, argon-atom interactions other than those between that atom and the three neighboring calcium atoms and the next near-neighbor argon atoms are neglected. Given the above, it is possible to calculate the interaction energy, Ea, of an argon atom at all possible configurations that may occur on the surface:
where n is the number of next-nearest-neighbors sites, which are already occupied by argon atoms. In the case of a rough surface, this expression is somewhat modified because some of the next-nearest-neighbor interactions are between argon and calcium. These energies are then used to determine the probabilities of events occuring on a stochastic basis, which forms the basis for the time evolution of the surface. This link between the local atomic structure and the probability for adsorption or desorption is the key feature of the model. The incoming atoms are assumed to have a Maxwellian distribution of kinetic energies, e:
where T is the temperature in Kelvin, and k is Boltzmann's constant. The fraction of incoming atoms that adhere to the surface depends on the substrate's ability to dissipate enough kinetic energy for the colliding atom to become trapped in the potential well of the site. Thus, we make the following assumptions:
 Assuming a single-step activated process, the probability, Pdes, that desorption occurs between t and t + dt is given by
where the desorption rate, Rd, is given by
where gd is a geometric factor taken to be unity, fo is the attempt frequency, and Ea is the usual environmentally dependent interaction energy. Thus, the total number of atoms that desorb over a single time step, st, is
 To a good approximation, the attempt frequency is equivalent to the vibrational frequency of the gas atom on the surface. Thus,
To relate the results to seconds, the characteristic attempt frequency of argon can be taken as 4.45 x 10¹⁰ s-1, a value calculated by fitting a harmonic function to the energy profile of an argon atom at a site with six occupied next-nearest neighbors. However, since the interaction energy varies according to the number of occupied next-nearest neighbors, such an analysis is imprecise. Therefore, the results are reported in time steps rather than in seconds. During each time step, the number of gas atoms that strike the surface are defined by a flux such that
 In this study, we compare the evolution of surfaces exposed to the same flux at different temperatures. The flux used here was eight percent (i.e.,the number of gas atoms that were allowed to interact with the surface corresponded to eight percent of the total number of surface sites [B and C]). |
N lattice sites are randomly selected, representing locations where the atoms strike. A specific location is identified by the particular CA cell in which it is located and by the label B or C, indicating the lattice site within the cell. Rather than report the N used for a simulation, fN is given because it scales with the number of surface sites (defined as the number of CA cells).
The richly illustrated, video-enhanced supplements present results associated with
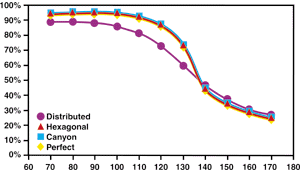
The generally constant coverage below 115 K is the result of an interplay between two processes. At the lowest temperatures, there are still a number of growth faults after 10,000 time steps, which, given their lower site density, reduce the overall coverage. In addition, there are a small number of missing gas atoms in the interior of the gas-atom domains (i.e., point defects). This is apparent in Figure Ac of Supplement I: Results Associated with a Perfect Surface. As the temperature rises, there are fewer growth faults but more point defects (see, for example, Figure Bc and Figure Cc in Supplement I). Nevertheless, the surface is effectively stable since each gas atom is surrounded by a majority complement of its next-nearest neighbors.
Once the temperature reaches 125-130 K, the coverage reduces rapidly. The rate at which atoms leave the surface becomes sufficiently high so that each gas atom has a significantly less-than-full complement of next-nearest neighbors. Consequently, the energy required to remove each gas atom, Ea, is smaller, and gas atoms more readily leave the surface. This is the origin of the dramatic reduction in surface coverage rather than exponential decay, which would be expected purely on the basis of increasing temperature.
Figure 3 also presents data for the hexagonal feature. In this case, the variation in coverage is practically identical to that found for the perfect surface. However, in Supplement III: Results for a Hexagonal Surface Feature, it was observed that, to a certain extent, the growth proceeded from the hexagon (pause Movie K and view the frames at the very beginning of the simulation). Hence, it is interesting that this did not have an effect on the overall coverage after 10,000 time steps. The hexagon may affect the initial nucleation and growth, but this is a local process which, after a certain point, becomes unimportant to the slower growth process. Similarly, the small amount of enhanced B site coverage around the hexagon at 140 K did not lead to enhanced coverage, and the surface remains unstable (see the results section in Supplement III).
 |
| Figure 3. The coverage at 10,000 time steps for perfect and imperfect 100 x 100 atom surfaces. |
The observations on the canyon feature (see Supplement IV: Results Associated with a Canyon Surface Feature) show that there are a number of characteristics in common with the hexagon (see Supplement III). For example, the existence of the feature causes nucleation and growth of same-site gas atom structures over the first 1,000 time steps adjacent to the feature; this stabilizes the growth of the single-site domains. However, in Figure 3, the canyon simulation shows essentially the same coverage at 10,000 time steps as does the hexagon and perfect surfaces. Again, the existence of a feature has a strong influence on what initially nucleates and grows, but not on the overall coverage after the initial period.
Because the canyon feature is composed of two different site features opposite each other, the result is growth of two different site domains. The 90 K, 100 K, and 120 K simulations after 10,000 time steps yield microstructures that are intergrowths. The remaining 90% of the simulation time (i.e., to 100,000 time steps) is required for a clear bimodal microstructure to develop. By comparing the 90 K, 100 K, and 120 K simulations, it is clear that at the higher temperature, the structure is more developed toward some form of equiilibrium, although there is still a greater proportion of B site (red) gas atoms than C site (blue). Because of the equivalence in the energetics associated with B- and C-site gas atom absorption and the nature of the periodic boundary conditions, such a straight equal-proportioned microstructure might be expected; however, this type of simulation would also allow investigations on the extent of the boundary fluctuation as a function of temperature and gas-atom flux.
Supplement II: Results Associated with Distributed Surface Roughness). For this surface, the analysis of coverage temperature shows quite a different behavior than that for the perfect, hexagonal, and canyon surfaces. In particular, the total coverage at low temperatures is significantly less, and as the temperature is raised, there is immediately a gradual reduction in coverage. Hence, the dramatic fall in coverage exhibited by the other types of surface is not seen when the roughness is randomly distributed. By 140 K, the coverage for this surface is effectively the same as for the other surfaces, because the gas-atom coverage of all surfaces is highly unstable.
Consider the development of the distributed rough surface at 90 K (see Figures Ea-Ed in Supplement II). After 100 time steps, the distributed rough surface morphology is very similar to that of the perfect surface. Even after 1,000 time steps, these rough and perfect surfaces are fairly similar, although the domains of the perfect surface are now a little larger. After 10,000 time steps, the surfaces are quite different, with the domain size growth of the distributed roughness surface being effectively arrested. It is tempting to state that the domain size has been pinned, but by 100,000 time steps there is some indication that more growth has occurred, although the effect is small considering the number of time steps has increased by an order of magnitude. Therefore, it would be interesting to increase the number of time steps by at least another order of magnitude to see if the effect is truly one of pinning or massively retarding.
An interesting observation is that for the distributed roughness surface, the domain size at 1,000 time steps and beyond is greater than the distance between the additional surface calcium atoms (see, for example, Figure Fc in Supplement II). Consequently, each domain contains a number of additional calcium atoms. Furthermore, we observe that the surface calcium atoms do occupy both B and C sites within each domain; clearly, the additional calcium atoms are not simply acting as classical nucleation points. The reason the microstructure becomes contained in the way that it does is a complex interplay between the specific surface roughness distribution and the initial random deposition process over the first few hundred time steps. It would be interesting to further analyze the relationship between roughness distribution and the resulting microstructure, including varying the amount of surface roughness and the gas-atom flux rate. Finally, other distributions of surface roughness, intermediate between the totally random and condensed features presented in this work, would be possible.
There is a strong incentive to develop simulation methods that accurately predict physical phenomena independently of experiment. Given the overwhelming complexity of real systems, this approach may not be the most practical. A more practical alternative is to adjust a representative set of atomistically derived parameters for the CA rule set in order that a limited number of experimental microstructures are accurately reproduced. Such a procedure would provide a simple check for the validity of the model and effectively provide a more accurate simulation. Ideally, the parameters would only need fine adjustments to reproduce the experiment, thereby preserving the atomistic interpretation of phenomena associated with the microstructural evolution. Furthermore, this approach would avoid over parameterization and an unnecessarily complex model. Once the parameters are calibrated to a set of well-characterized experimental data (i.e., where process variables, such as temperature and flux, are well known), the process variables could then be varied in the CA simulations to determine the optimal experimental conditions for producing a prescribed microstructure.
Reference
1. M.O. Zacate et al., Modelling and Simulation in Materials Science and Engineering, 7 (1999), pp. 155-167.
ABOUT THE AUTHORS
K.J.W. Atkinson, Robin W. Grimes, and Matthew O. Zacate are with the Atomistic Simulation Group, Department of Materials, Imperial College. Peter D. Lee is with the Materials Processing Group, Department of Materials, Imperial College. Al G. Jackson is with the Materials Directorate and Steve R. LeClair is with the Materials Process Design Branch, Wright-Patterson Air Force Base.
For more information, contact R.W. Grimes, Department of Materials, Imperial College, Prince Consort Rd, London SW7 2BP; telephone 44-0171-594-6730; e-mail r.grimes@ic.ac.uk.
Direct questions about this or any other JOM page to jom@tms.org.
| Search | TMS Document Center | Subscriptions | Other Hypertext Articles | JOM | TMS OnLine |
|---|