 |
http://www.tms.org/pubs/journals/JOM/9908/Jones/Jones-9908.html
|
 |
http://www.tms.org/pubs/journals/JOM/9908/Jones/Jones-9908.html
|
 |
|---|
| TABLE OF CONTENTS |
This work seeks to develop a metalorganic chemical vapor deposition (MOCVD) system using in-situ sensors and automated process control to deposit controlled, reproducible oxide fiber coatings (e.g., LaAl11O18). A CVD system capable of continuous fiber coating has been assembled that employs liquid precursor delivery for precise precursor stoichiometry control and inert gas seals for near atmospheric operation. A mass spectrometer and in-situ thermocouples are used for process measurements, and all system parameters are logged and are controllable by computer. A fuzzy logic controller has been developed to control the O2 flow rate based on the desired temperature or gas composition. A neural model of the process has been developed that translates the process settings into expected gas composition.
The work described here entails advancing the state of the art in CVD fiber coatings in terms of measuring coating properties during real time deposition. These properties include chemistry, crystallinity, thickness, and topography. The steps that are needed to reach this goal include:
By using a gas-phase model of the CVD exhaust by-products in-situ, confidence in the sensor increases when the model and sensor are in agreement. When differences arise between the model and the sensor, either a region has been determined where our knowledge of the process has increased or there is a fault in the sensor/CVD process.
The system chosen for study was an oxide coating—LaAl11O18—to be deposited on sapphire fiber. This coating is one member of a family of alumina/magnetoplumbite compounds that has been identified as potentially valuable for interface coatings in ceramic-matrix composites.2–4 Liquid precursor delivery is used to precisely control the stoichiometry of the coating material.
 |
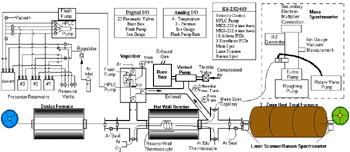
| Figure 1. The modular fiber CVD system. |
The vaporization chamber provides for the ability to vaporize the liquid precursor by using a porous frit. The frit allows argon gas to continuously pass through, while the liquid precursor vaporizes as it passes through the frit. If vaporization conditions are incorrect, unvaporized solid material will build up and eventually clog the frit. Over-pressurization above the frit would result and be indicated by the vaporizer pressure transducer.
The fiber first passes through a desize furnace, which can be heated to 1,200°C. Oxygen is also injected into the desize furnace to enable fiber desizing and cleaning. The fiber then proceeds through an inert gas seal, inlet cross, hot-wall reactor, outlet cross, and, finally, through an outlet inert gas seal. Although the three-zone heat-treat furnace is in-line, it can have a controlled atmosphere. The size of the inert gas seal orifices and the argon flow are such that there is a slight over-pressurization relative to both the atmosphere and the inlet cross. Argon from the seals is forced both into the atmosphere and the inlet cross ensuring the integrity of both the atmosphere and internal CVD reaction process.
The inert gas seals, inlet cross, inlet process gases, and outlet cross are all heated to prevent condensation. The fiber transitions through a large temperature gradient as the hot-wall reactor is heated to typically more than 600°C, compared with the 275°C of the four-way stainless steel cross that connects the vaporizer, inlet gas seal, and process gas inlet to the reactor. The hot-walled reactor consists of a quartz tube (2.54 cm in diameter and ~30 cm long) that can be heated to 1,200°C. The outlet cross connects the reactor to the outlet seal, mass spectrometer capillary, in-situ thermocouples, and reactor exhaust. The 1 m long heated capillary provides for analyzing gases before any condensation can occur.
The reactor pressure is maintained at 1 torr below atmospheric pressure through the use of a venturi pump system. By regulating the amount of compressed air through the pump, the amount of effluent pulled through the pump is controlled. A differential pressure transducer with a 10 torr span, 5 V range, is used to precisely measure the difference between atmospheric pressure and the reactor exhaust pressure. An MKS 250B pressure controller regulates the flow of compressed air through the venturi via throttle valve in-line with the compressed air (~620 kPa). Using this configuration, the exhaust pressure can be held to within ±0.1 torr of the setpoint.
The effluent flows through a burn box (heated to greater than 500°C) before exiting into a fume hood. This ensures that any residual hydrocarbons are fully oxidized. Since the effluent is diluted with compressed air while in the venturi pump, excess oxygen is available if needed.
The entire CVD system has been automated and can be operated from a computer platform. The automated components include the seven mass-flow controllers and corresponding gate valves, the venturi pressure system, 13 PID (proportional, integral, and derivative) temperature controllers, four thermocouples, three pressure transducers, all load-distribution system components, and the fiber take-up spool velocity. In-situ sensors were also integrated into the computer platform, including a mass spectrometer, laser thickness monitor, Raman spectrometer, and thermocouples inside the reactor.
 |
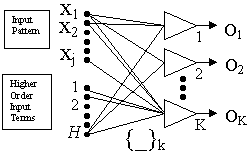
| Figure 2. The functional link neural network. |
Three type-K thermocouples are located at selected locations within the reactor tube. Another type-K thermocouple resides outside the reactor tube and is used for furnace temperature control. Each of the three thermocouples are connected to nonlinearized signal-conditioning modules having a 10 V range for –100°C to 1,350°C. Each signal is acquired using a 12-bit analog/digital conversion and linearized using an eighth order polynomial.
A functional link network (Figure 2) is a single-layer neural network that is able to handle linearly nonseparable tasks due to appropriately enhanced input representation.6 Expanded input data are then used for training rather than the actual input data. Higher order terms applied at the bottom inputs of the functional link network to produce a linearly independent pattern that is different from the original pattern components, as depicted in Equation 1:
| Fk(x) = bJX + Hbhg(aJX + bJ) | (1) |
This enhances the input representation, and the linear separability can be achieved in the extended space.7 The external parameters (Bk) can be learned using the "one-shot" training procedure of computing a single least-squares computation, while the internal parameters can be chosen at random.8
In one series of experiments, the CVD system was used to generate mass spectrometer and thermocouple data at 66 different pairs of oxygen-flow rates and reactor temperatures. The oxygen-flow rate was varied between 0 cm3/s and 1,000 cm3/s in steps of 100 cm3/s. The temperature of the reactor was set between 300°C and 800°C in steps of 100°C. Mass spectrometer data collected under these conditions at the exhaust of the reactor contain the carrier gas and, primarily, by-products from combustion: Ar, O2, H2O, CO2, CO, CH3, C2H5, and C2H2. A sample training set is shown in Figure 3 for water vapor.
A network trained using Sin and Cos augmentation is shown in Figure 5. The resulting neural network contained six inputs and one output. Forty sigmoid functions were used to augment the functional link neural input. The neural model was sampled using four times the resolution on which it was trained. Although the training error was reduced with the addition of each sigmoid function, the resulting model shows very poor generalization as compared with that of Figure 4.
References
1. T.O. Sedgewick and H. Lydtin, eds., Proceedings of the 7th International Conference on Chemical Vapor Deposition (Princton, NJ: Electrochemical Society, 1979).
2. M.K. Cinibulk, "Magnetoplumbite Compounds as a Fiber Coating in Oxide/Oxide Composites," Cer. Engng. Sci. Proc., 15 (5) (1994), pp. 721–730.
3. P.E.D. Morgan and D.B. Marshall, "Functional Interfaces for Oxide/Oxide Composites," Mat. Sci. Engng., A162 (1993), pp. 15–25.
4. S. Sambasivan, J.A. Moris, and W.T. Petusky, "Rb-Alumina as an Interface Coating in Oxide CMCs," Cer. Engng. Sci. Proc., 17 (4) (1996), pp. 250–257.
5. J.G. Jones, Intelligent Process Control of Fiber Chemical Vapor Deposition (Ph.D. dissertation, University of Cincinnati, 1997).
6. Y.H. Pao, Adaptive Pattern Recognition and Neural Networks (Reading, MA: Addison-Wesley Publishing Co., 1989).
7. J.M. Zurada, Introduction to Artificial Neural Systems (St. Paul, MN: West Publishing Co., 1992).
8. C.L.P. Chen, S.R. LeClair, and Y.H. Pao, "A Rapid Supervised Learning Neural Network for Function Approximation and Time-Series Prediction," Proceedings of Ohio Aerospace Institute Neural Net Conference (Ohio Aerospace Institute, 1995), pp. 23–34.
ABOUT THE AUTHORS
J.G. Jones and P.D. Jero are with the Air Force Research Laboratory, Materials Directorate, Wright-Patterson Air Force Base.
For more information, contact J.G. Jones, AFRL/MLMR, 2977 P Street, Suite 13, WPAFB, Ohio 45433-7746; (937) 255-8787; fax (937) 656-7995; e-mail John.Jones@afrl.af.mil.
Direct questions about this or any other JOM page to jom@tms.org.
| Search | TMS Document Center | Subscriptions | Other Hypertext Articles | JOM | TMS OnLine |
|---|