The assessment of corrosion on the
USS Arizona included the pioneering
development of a minimum-impact costeffective
technique to determine the corrosion
rate of steel-hulled shipwrecks in
seawater. The technique, with potential
application worldwide, is illustrated
in this paper with the application to a
World War II Japanese midget submarine
submerged in deep waters off the Oahu,
Hawaii, coast.
INTRODUCTION
In the early morning hours of
December 7, 1941, five Japanese class
I fleet submarines launched five midget
submarines ten miles off Pearl Harbor.
The mission was to covertly slip into the
harbor, wait until the attack by Japanese
forces on Pearl Harbor began, then fire
their torpedoes. Each vessel was 23.7 m
long, had a beam of 1.8 m, and a 1.4 m
conning tower. Each submarine carried
a crew of two and two torpedoes. At
3:57 a.m., Ensign R.C. McCloy, minesweeper
Condors officer of the deck,
spotted something off his port bow and
called over Quartermaster R.C. Uttrick.
Thats a periscope sir, and there arent
meant to be any subs in this area. Ensign
McCloy blinked a semaphore to USS
Ward, Sighted submerged submarine. . . . Captain William W. Outerbridge,
who earned his command only two days
before, sounded general quarters, but
secured at 4:35 a.m. having made no
contact. At 5:50 a.m., Antares skipper,
Commander Lawrence C. Grannis,
reported another sighting to Ward. By
6:40 a.m., Captain Outerbridge spotted
a conning tower trailing Antares at the
entrance to Pearl Harbor, closed to 45.7
m, and fired a 10.2 cm round into the
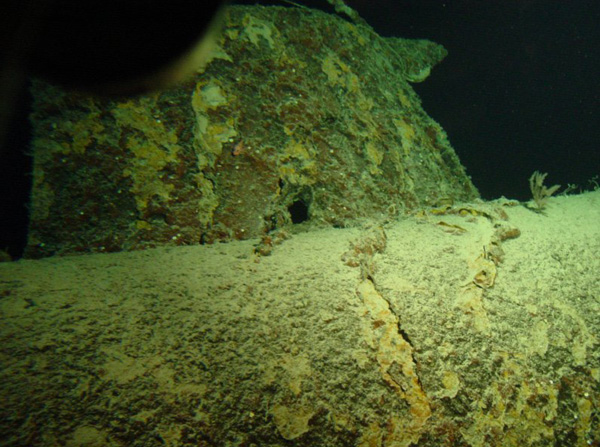
target. Although surviving documentation
does not reveal that the site was the
submarine sunk by Ward, evidence from
the site, such as a shell hole at the starboard
base of the conning tower (Figure
1) corresponds to the action report filed
by Ward identifying the submarine as
the first vessel sunk by the U.S. Navy
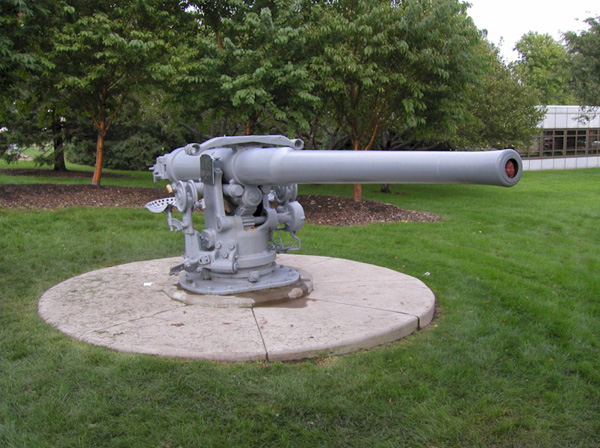
in the Pacific war of World War II.1 The
#3, 10.2 cm gun from Ward, which fired
the shot that sank the submarine, is now
located on the Capitol Mall in St. Paul,
Minnesota (Figure 2).
At 7:53 a.m., the Japanese initiated a
surprise air attack against U.S. Forces
stationed at Pearl Harbor and other
military sites on Oahu, Hawaii. During
the first wave, consisting of 183 fighters
and torpedo bombers, Arizona became
a total loss when a bomb penetrated the
deck and sympathetically detonated its
forward magazine. After the second
wave of the attack consisting of 167
aircraft was over, 22 additional ships
were damaged or totally lost with 2,403
killed in action, 1,173 of whom were lost
on Arizona.
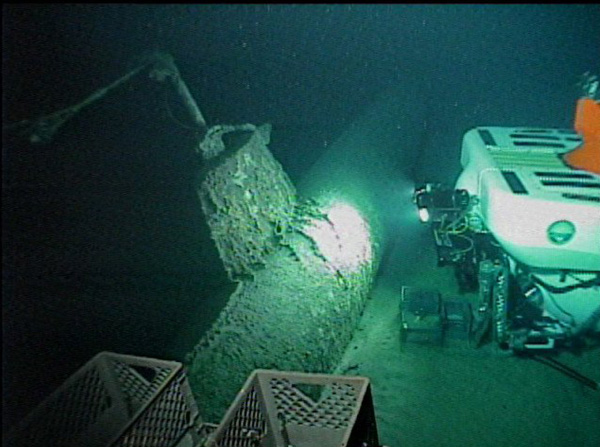
In August 2002, researchers in a
Hawaiian Undersea Research Laboratory
(HURL) submersible discovered this
Japanese midget submarine approximately
4.83 km offshore from the
entrance to Pearl Harbor, in 406.7 m of water. In a later submersible descent,
several small segments of marine concretion
were recovered from the aft end of
the midget sub by the robotic arm of
HURLs Pisces submersible (Figure 3).
These samples were analyzed in metallurgical
and chemistry laboratories at
the University of NebraskaLincoln, and
x-ray diffraction measurements were
conducted at the Air Force Research
Laboratory, Eglin Air Force Base,
Florida. The purpose of this paper is to
review Corrosion Equivalent Corrosion
Rate (CECR) methodology,2 a minimum
impact technique pioneered on Arizona,
and its application to estimate the average
corrosion rate of the external hull of
the midget submarine. A second purpose
is to present the results of x-ray diffraction
studies on the concretion samples
and to relate these results to physical and
chemical properties of the submarines
concretion.
TEST SITES
USS Arizona
The Arizona remains submerged
where it was sunk by Japanese forces on
December 7, 1941. An estimated 1.9
million liters of fuel oil remain aboard,
either in original bunkers or trapped
beneath overheads of numerous undamaged
compartments. Limited salvage
operations on the vessel were terminated
in 1942. A thorough archeological
documentation of the wreck was initiated
by the National Park Service and the
U.S. Navy at the request of the USS
Arizona Memorial superintendent in
1983. A detailed document including
history, drawings, photographs, analysis,
and recommendations for site management
was published in 1990.3 This initial
document reported the earliest attempt
to examine in-situ corrosion processes
on a sunken steel ship. An interdisciplinary
research program, the USS Arizona
Preservation Project, began in 1999 to
conduct a comprehensive study of corrosion,
structural integrity, microbiology,
sub-surface geology, and oceanography
relevant to the in-situ site formation
processes affecting the vessel. The data
are providing critical inputs to a finite
element model, which will constitute a
composite research product to be used
by managers in making future preservation
decisions about the ship.
Several documents have been published
since the Preservation Projects
inception. The following references are
specific to corrosion studies on the Arizona,
and serve as the background for
research done on the Japanese midget
submarine that is the subject of this paper.
References 47 contain information
concerning the metallurgy,4 potential/pH
and metal coupon data,5,6 and minimum
impact corrosion rate measurement
technique.2,7
Table l. Physical and Chemical Properties of Japanese Midget Submarine Concretion, and
Calculated Concretion Equivalent Corrosion Rate (CECR)
|
Sample
|
Fe (wt.%)
|
d (cm)
|
Density* (g/cm3)
|
H2o (wt.%)
|
icoor (CECR)** (mmpy)
|
| S1 |
52.7
|
0.335
|
2.017
|
25.5
|
0.012
|
| S2 |
55.5
|
0.272
|
2.511
|
20.7
|
0.012
|
| S3 |
61.8
|
0.523
|
1.619
|
50.3
|
0.017
|
| S4 |
63.0
|
0.424
|
1.520
|
54.5
|
0.013
|
| S5 |
58.3
|
0.447
|
1.809
|
39.6
|
0.015
|
| S6 |
54.7
|
0.345
|
2.005
|
27.8
|
0.012
|
| Avg. |
57.7
|
0.39
|
1.91
|
36.4
|
0.014
|
* ASTM Designation D792-00;
** Equation 1
|
|
Japanese Midget Submarine
The midget submarine hull was fabricated
from cold-rolled MS44, low-carbon,
basic open-hearth steel to an
original wall thickness of 8 mm.8 With
no direct access to the submarines hull,
it was impossible to obtain metal samples
that could directly reveal the extent of
metal loss by laboratory metallographic
methods. Ultrasound measurements
were not attempted because experience
with the heavily concreted Arizona hull
has not provided conclusive data,6 and
the method has not proven to be reliable
with current technology. Electrochemical
methods might be useful, but instantaneous
data may not accurately reflect
long-term corrosion. In addition, it would
be expensive to monitor and service in-situ
instrumentation on site. As a result,
the Japanese midget submarine discovered
in 2002 appeared to be a suitable
test site for the application of CECR
methodology.2,7
METAL/CONCRETION INTERACTIONS
USS Arizona
FeCO3 (siderite), CaCO3 (aragonite),
and Fe3O4 (magnetite) were the three
major minerals present in Arizona concretion
identified by a Siemens x-ray
diffractometer. Iron contents varied from
1865 wt.%, with an average of approximately
50 wt.% using environmental
scanning-electron microscope (ESEM) cross section scanning.7 Based on these
observations, studies were initiated on
Arizona to correlate iron content in the
concretion with the average corrosion
rate obtained from analysis of metal
coupons removed from the hull in 2002.
Results of this correlation are shown in
Equation 1, where icorr(CECR) is given.
(All equations are shown in the table on
page 17.) In this equation, K = 0.020 for
icorr in millimeters per year (mmpy); ρ
is concretion density (g/cm3); wt.% Fe
is weight percent iron; d is concretion
thickness (cm); and t = 61 is exposure
time (γ).
Japanese Midget Submarine
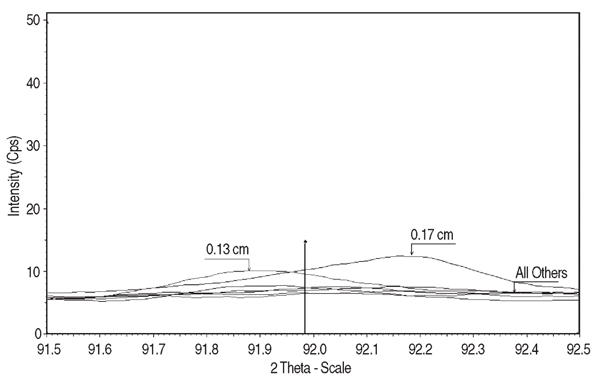
As with Arizona concretion, a Siemens
x-ray diffractometer was used to scan the
cross section of the midget submarine
concretion samples from shipside to seaside
at distances 0.03 cm, 0.05 cm, 0.08
cm, 0.13 cm, and 0.17 cm for siderite,
goethite (FeOOH), and magnetite.11 The
diffractometer was situated on the calculated
2-theta peak for each mineral, and
then scanned on either side from 0.5 to 1
degree so as to include the entire profile
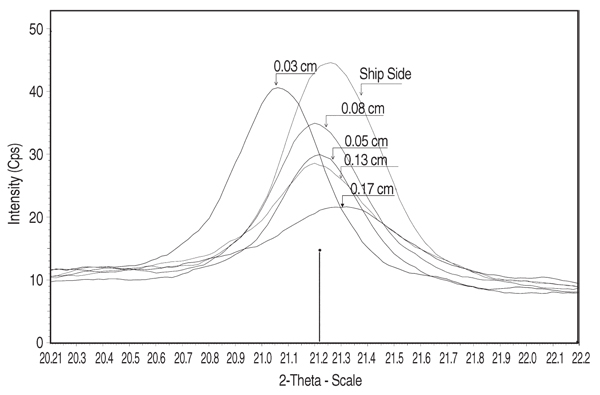
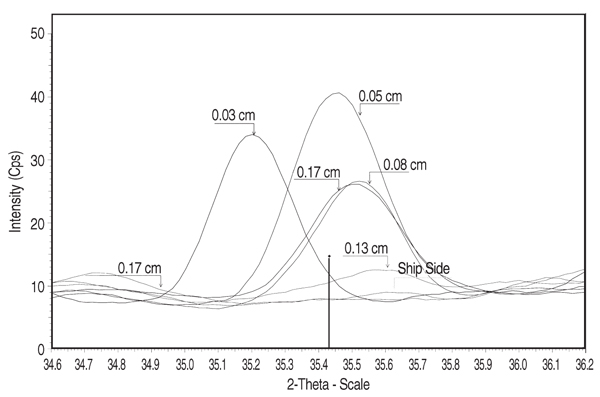
caused by line broadening. Figures 4,
5, and 6 show the profiles for siderite,
goethite, and magnetite, respectively,
as a function of 2-theta angle and linear
intensity (counts per second, Cps). As a
general rule, intensity is approximately
proportional to the concentration of a
measured compound. Siderite occurs
throughout the cross section, but appears
to reach maximum concentration at the
interior of the concretion toward seaside
at 0.17 cm. Goethite is highest in concentration
toward shipside at 0.03 cm,
and lowest toward seaside at 0.17 cm.
Similarly, magnetite is highest in concentration
toward shipside at 0.030.05
cm and lowest toward seaside at 0.17
cm. Aragonite does not appear in the
x-ray scans of the submarine concretion,
although it does appear in Arizona
concretion as mentioned previously.
Maximum siderite toward seaside
(Figure 4) suggests that iron diffusion
through the concretion is fast relative
to siderite formation kinetics. The exact
mechanism by which siderite forms is
unknown, but it is probably related to
iron exchange with calcium in calcium
carbonate.12 North reported that the
original aragonite skeletal material was
converted into various iron compounds
with siderite being the most common.
Maximum goethite and magnetite toward
shipside (Figures 5 and 6, respectively)
suggests that oxygen diffusion is fast
relative to iron oxide formation kinetics.
The presence of goethite in the concretion
rather than at the metal/concretion
interface, as in the case of Arizona, may
explain the higher iron content in the
midget submarine concretion than in
Arizona concretion. Although a chloridecontaining
oxide, akaganeite, appears in
Arizona scale, no chloride containing
oxides appear in the midget submarine
concretion. Other research indicates that
akaganeite forms after the concretion is
exposed to air,13 which may explain the
presence of this mineral in Arizona concretion,
but it does not explain its absence
in the midget submarine concretion.
CORROSION
Concretion Equivalent
Corrosion Rate
From a collection of midget submarine
concretion samples, the six largest
were designated as samples S1, S2, S3,
S4, S5, and S6. To begin, concretion
density was measured, then thickness
and water content were determined.
Last, the samples were ground to a fine
powder and delivered to the Department
of Chemistry analytical laboratory at the
University of Nebraska-Lincoln for iron
analysis using wet chemical methods.
The data, including CECR data from
Equation 1, are given in Table I.
The CECR predicts an average corrosion
rate of 0.014 mmpy, corresponding
to a total hull loss of 0.9 mm, with
approximately 7.1 mm of metal remaining.
For comparison, Arizona concretion
contained significantly lower iron,
varying between 2248 wt.%, greater
concretion thickness, averaging 1.8 cm, greater concretion density, varying from
1.92.5 g/cm3, and lower water retention
at approximately 14 wt.%.
Corrosion MechanismLimiting
Current
In sea water, oxygen reduction at
cathodic sites is typically the driving
force for the corrosion process. Assuming
oxygen reduction is the only cathodic
reaction, the limiting corrosion rate is
calculated using Ficks First Law according
to Equation 2, where: icorr(l) is the
limiting corrosion rate (mpy), J = KDC/
d is the oxygen flux through concretion
(g O2/cm2/s), K = 0.012 for icorr in mmpy,
D is the diffusion coefficient for O2 in
water (cm2/s), d is concretion thickness
(cm), n is the number of equivalent
electrons transferred per gram atomic
weight, F is the Faraday constant (A·s/
e-), and C is the oxygen concentration
at the concretion/seaside interface, or
gradient across the concretion assuming
C at the concretion/metal interface ≈ 0
(mg/L).
The diffusion coefficient for oxygen
in water, D, is estimated at 8.8°C using
D25 · (T/T25)(µ25/µ), where D25 is the diffusion
coefficient for oxygen at 25°C, µ
is the viscosity of water, and T is absolute
temperature. At 8.8°C, D equals 1.72 ×
105 cm2/s14 and C(sat) = 47.24%. Based
on a mean temperature of 8.8°C at a
water depth of 406.7 m,and a mean
salinity of 34.1, C(sat) converts to C =
4.42 mg/L, with a standard deviation of
0.9 mg/L.15 From Table I, d (average) =
0.39 cm, n = 2/16 = 0.125, and F = 96,500
A·s/e-. When these values are substituted
into Equation 2, Equation 3 results.
Comparison to the CECR indicates
that icorr (O2 reduction) is greater than icorr
(CECR) by approximately 0.014 mmpy.
This difference may be caused by rate-limited
mineral formation kinetics in the
concretion. It is of interest to note that
the corrosion rate from coupon measurements
on Arizona is greater than that
calculated from Equation 2, the opposite
of that observed on the midget submarine.6 The authors suggest that hydrogen
discharge, stimulated by microbial activity,
supports corrosion on Arizona, but
is less of a factor on the midget submarine.
16
CONCLUSION
Based on CECR, the average corrosion
rate of the Japanese midget
submarine hull, submerged in 406.7 m
of sea water, is estimated to be 0.014
mmpy, corresponding to a 61 year loss
of approximately 11% of its original hull
thickness. Iron in the midget submarine
concretion appears in the form of the
minerals goethite, magnetite, and sideriite. Formation kinetics of these minerals
may be rate limiting. Unlike Arizona
concretion, aragonite was not detected.
High water retention, combined with low
concretion thickness, may explain the
high oxygen availability at the metal/concretion
interface. To lend support to these
conclusions, two avenues of approach
are being pursued. The first is to search
for other marine sites where it is feasible
to collect concretion samples, and measure
on-site environmental parameters:
oxygen saturation (%), temperature,
salinity, and pH. The second approach
is to conduct an in-depth study of concretion
morphology with corresponding
experimental measurement of iron and
oxygen diffusivity, and kinetics of formation
of iron-bearing minerals in the
concretion.
While water depth reflects environmental
properties, incorporation of these
environmental properties directly into
Ficks First Law for limiting current can
be used to better understand the corrosion
process.
ACKNOWLEDGEMENTS
The USS Arizona Preservation Project
is funded by the Department of Defense,
Legacy Resource Management Fund;
National Park Service System Wide
Archeological Inventory Program;
National Park Service Submerged
Resources Center; USS Arizona Memorial
and Arizona Memorial Museum
Association. Additional thanks to Terry
Kerby, Hawaiian Undersea Research
Laboratory, University of Hawaii;
National Oceanic and Atmospheric
Administration (NOAA)/National Ocean
Service Pacific Islands Region; Dan
Basta, National Marine Sanctuary
Program; Northwest Hawaiian Islands
National Marine Sanctuary; NOAA
Maritime Heritage Program and the
University of Nebraska Foundation. The
authors also thank Dr. John Makinson
(Rail Sciences, Inc.); Inspection Technologies,
Inc.; Titan Maritime Industries,
Inc.; and especially Doug Lentz for his
continuing support. This research is
dedicated to the memory of Dr. William
N. Weins.
ACKNOWLEDGEMENTS
1. Sid Moody with additional text by Hugh A. Mulligan,
Edited by Norm Goldstein, photo research by Susan
Brady, Pearl Harbor, 50th Anniversary Special Addition (Emeryville, CA: The Associated Press, Longmeadow
Press, 1991).
2. Matthew A. Russell et al., A MinimumImpact
Method for Measuring Corrosion Rate of Steel-Hulled
Shipwrecks in Seawater, The International Journal
of Nautical Archeology, 35.2 (September 2006), pp.
310318.
3. D.J. Lenihan, editor, Submerged Resources Study-
USS Arizona, Southwest Cultural Resources Center
Professional Papers, No 23, 2nd Edition (Santa Fe,
NM: National Park Service, 1990).
4. D.L. Johnson et al., Metallographic Studies on
USS Arizona, Microstructural Science, 27 (2000), pp.
8591.
5. J.D. Makinson et al., In Situ Corrosion Studies on
the Battleship USS Arizona, Materials Performance,
41 (10) (2002), pp. 5660.
6. Donald L. Johnson et al., Corrosion of Steel
Shipwrecks in Marine Environment, USS Arizona PART I, Materials Performance, 45 (10) (2006), pp.
4044.
7. Donald L. Johnson et al., Corrosion of Steel
Shipwrecks in Marine Environment, USS Arizona Part II, Materials Performance, 45 (10), pp. 5457.
8. Reports of the U.S. Naval Technical Mission to Japan,
19451946, Microfilm Publication 2 (Washington, D.C.:
Operations Archives, U.S. Naval History Division, May
1974).
9. Robert De Angelis, X-ray Diffraction and
Environmental Scanning Electron Microscope
Investigation of Concretion from the USS Arizona
Report (Eglin Air Force Base, FL: Air Force Research
Laboratory, 27 September 2002).
10. D.L. Johnson et al., Metallurgical and Corrosion
Study of Battleship USS Arizona, USS Arizona
Memorial, Pearl Harbor (Santa Fe, NM: Report to
Submerged Resources Center, 31 May 2003).
11. X-ray Presentation (Eglin Air Force Base, FL: Air
Force Research Laboratory, 21 January 2005).
12. Neil A. North, Formation of Coral Concretion on
Marine Iron, The International Journal of Nautical
Archeology and Underwater Exploration, 5.3 (1976),
pp. 253258.
13. Desmond Cook, Old Dominion University, personal
communication (12 March 2007).
14. Robert H. Perry and Cecil H. Chilton, editors,
Chemical Engineers Handbook, 5th Edition (New
York, NY: McGraw-Hill Book Company, 1973), pp. 3-
224, 3-212, 3-213.
15. David Murphy, Sea-Bird Electronics, Bellevue, WA,
personal communication (2006).
16. M. Schmacher, editor, Seawater Corrosion
Handbook (Park Ridge, NJ: Noyes Data Corporation,
1979), pp. 367387.
Brent M. Wilson, Donald L. Johnson, and James D.
Carr are with the University of NebraskaLincoln;
Hans VanTilburg is with NOAA National Marine
Sanctuary; Matthew A. Russell, Larry E. Murphy, and
David L. Conlin are with the National Park Service,
Submerged Resources Center; and Robert J. De
Angelis is with the University of Florida, Graduate
Engineering and Research Center, Shalimar, Florida.
Prof. Johnson can be reached at (623) 975-1657;
e-mail johnsondonl@aol.com.
|
 Presenting a Web-Enhanced