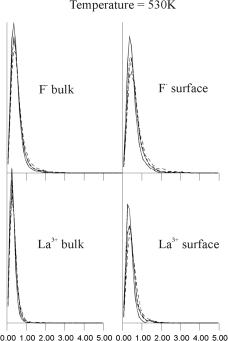
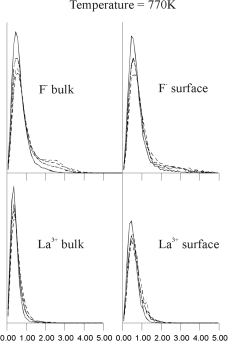
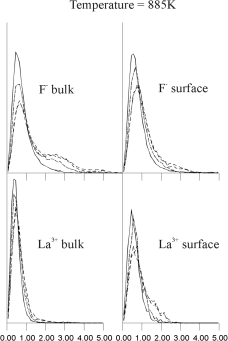
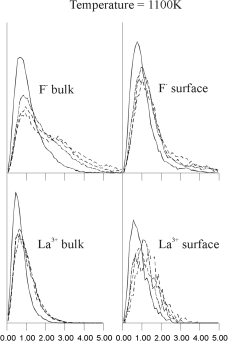
Figure 9. Shows the r-dependence of this function at several different temperatures. At each temperature the upper graph represents the F- van Hove function, the lower graph the La3+; the left-hand graphs represent Gs (r,t) for bulk ions, the right-hand graphs Gs (r,t) for bulk ions, the right-hand graphs Gs (r,t) for surface ions. These graphs show only one sharp peak at temperatures below 770K, which correspond to local oscillations of ions. However, the bulk F- van Hove autocorrelation function shows a second peak at 2.5 Angstroms, at a temperature of 770K, which corresponds to a jump of F- ions to a position which is between two regular lattice sites, i.e. interstitial. This result is consistent with lattice energy minimisation calculations and experiment which both suggest that Frenkel defects are the dominant mode of disorder in LaF3.17 When the temperature increases further to 885K and 1100K the amplitude and width of this second peak in the F- distribution increases, whereas the distributions for surface F- and both bulk and surface La3+ remain unimodular. At higher temperatures (not shown) all the graphs of the van Hove autocorrelation function became broader with no visible multimodular structure. (r,t) for surface ions. These graphs show only one sharp peak at temperatures below 770K, which correspond to local oscillations of ions. However, the bulk F- van Hove autocorrelation function shows a second peak at 2.5 Angstroms, at a temperature of 770K, which corresponds to a jump of F- ions to a position which is between two regular lattice sites, i.e. interstitial. This result is consistent with lattice energy minimisation calculations and experiment which both suggest that Frenkel defects are the dominant mode of disorder in LaF3.17 When the temperature increases further to 885K and 1100K the amplitude and width of this second peak in the F- distribution increases, whereas the distributions for surface F- and both bulk and surface La3+ remain unimodular. At higher temperatures (not shown) all the graphs of the van Hove autocorrelation function became broader with no visible multimodular structure. |


 a
a b
b c
c d
d (r,t) for bulk ions, the right-hand graphs Gs
 (r,t) for surface ions. These graphs show only one sharp peak at temperatures below 770K, which correspond to local oscillations of ions. However, the bulk F- van Hove autocorrelation function shows a second peak at 2.5 Angstroms, at a temperature of 770K, which corresponds to a jump of F- ions to a position which is between two regular lattice sites, i.e. interstitial. This result is consistent with lattice energy minimisation calculations and experiment which both suggest that Frenkel defects are the dominant mode of disorder in LaF3.17 When the temperature increases further to 885K and 1100K the amplitude and width of this second peak in the F- distribution increases, whereas the distributions for surface F- and both bulk and surface La3+ remain unimodular. At higher temperatures (not shown) all the graphs of the van Hove autocorrelation function became broader with no visible multimodular structure.