 |
http://www.tms.org/pubs/journals/JOM/9704/Bulatov/
|
 |
http://www.tms.org/pubs/journals/JOM/9704/Bulatov/
|
| CONTENTS |
|---|
Authors' Note: The work described here was performed at the Atomistic Simulation Group of the Imperial College in London. Funding for this project was provided by the EPSRC, grants GR/K38014 and GR/K74302.
Through model description and video example, atomistic molecular dynamics calculations are used to investigate the movement of F- ions in nanoclusters of LaF3, a well-known, fast, ion conductor. Surprisingly, interior, bulk coordinated F- ions are more mobile than F- on the surface of the cluster. Also, F- ion mobility occurs via a hopping mechanism both before and after the F- sublattice becomes disordered. Ion movement is mediated by at least two sites.
INTRODUCTION
The properties of very small particles are, in many ways, quite different from those of bulk solids. Their small size means that changes of phase are less well defined than for the bulk,1,2 and their properties are strongly influenced by surface effects. As technology begins to exploit nanostructured materials, whether for their electronic, optical, or mechanical properties, there is a growing need for an understanding of their fundamental properties. From a thermodynamic point of view, small clusters have been studied by Hill3 and, more recently, by Lynden-Bell.4 There have been several experimental and theoretical studies of very small clusters of atoms,5 both of metallic systems that exhibit "magic number" effects in their stability as a function of size and ionic systems.6
The work described here focuses on lanthanum fluoride, a relatively straightforward ionic material that nevertheless exhibits interesting behaviour in the form of a superionic transition, whereby the fluoride ions become mobile. In the bulk, this transition occurs at 1,100 K (the melting point is 1,766 K). We have applied molecular dynamics to this system and have studied clusters of 160 ions, 552 ions, and 3,120 ions over temperatures ranging from a few degrees K to the vaporization point. In particular, the work has focused on ion diffusion and its mechanism, with special attention being given to differences between ions on the surface and ions in the interior of the cluster.
MOLECULAR DYNAMICS
The molecular dynamics technique is a computer simulation method that specifically models the motion of the ions in a lattice—both vibrational motion and the migration of ions. This is achieved by solving Newton's equations of motion iteratively. That is, we use a Taylor expansion to predict, at time (t0 +  dt), the position of an atom [e.g., r(t0 +
  dt)], if, at time t0, the position of a particle was r(t0), its velocity was v(t0), and its acceleration was a(t0).
 t) = r(t0) +
  t v(t0) + 1/2
  t 2a(t0) + 1/6
  t 3b(t0) + ...
where b(t0) = d3r/dt3 and the suffix, p, indicates a predicted variable. Similarly we can predict expressions for velocity and so on:
 t) = v(t0) +
  ta(t0) + 1/2
  t 2b(t0) + ...
 t) = a(t0) +
  t b(t0) + ...
The accuracy of these expressions is improved if more higher order terms are used. Experience suggests that, for the present purposes, we can safely terminate after fifth order. The second limiting factor is the size of the time step  t; the smaller the size of
  t, the more accurate the prediction. Of course, the smaller the time step, the more calculations needed to model a real time period in the history of a material. A typical time step in these calculations is 10-15 seconds, although, in our method, this value is not fixed.
After each time step, the total force experienced by each ion, due to its interaction with all other ions in the cluster, is calculated. Since the study described here concerns a highly ionic material, the classical Born ionic model is used to describe these forces.7 This model is usually used to predict static lattice energies where, in our variant of the model, the total potential energy is given by;
 {qiqj/rij + Aij exp (-rij/pij)-Cij/rij6 + Cij/rij12}
where Aij,  ij, and Cij are adjustable parameters. Thus, in effect, the lattice energy of the nanoclusters is calculated at each time step. Of course, since the positions of the ions change with time, the lattice energy will vary about a mean value. The balance is maintained in the fluctuating kinetic energy. Therefore, the total energy of the system can also be calculated. Now, it is possible to check on the time-step approximation. If the total energy of the system varies by more than a predetermined amount between successive time steps (typically 0.001 eV), the time step must be reduced until energy is conserved. This variable time-step control is a particular feature of the presented method.
The values of the parameters in the potential energy expression are chosen to reproduce a variety of experimental data. In this work, we fitted to the lattice parameter and elastic constants of bulk LaF3.8 Usually, however, the structure of the molecular species is also used (if available).9
Since it is possible to calculate the forces between ions subject to the ionic model, it is a simple matter to translate them into accelerations. As such, one can compare the accelerations of the ions predicted from the Taylor expansion, ap(t0 +  t), to the calculated accelerations of the independent model, ac(t0 +
  t):
t):
 a(t0 +
  t) =
ac(t0 +
  t) -
ap(t0 +
  t)
t)
The term  a(t0 +
  t) can then be used to correct other variables:
 t) = rp(t0 +
  t) + c0
 t2
t2 a(t0 +
  t)
t)
where the coefficient c0 = 3/20, as determined by Gear.10 Similar coefficients can be employed to correct other variables (e.g., velocity). The MD method used here is, therefore, known as a Gear fifth-order predictor-corrector algorithm.
Since the positions, velocities, etc., are predicted at time (t0 +  dt) from a knowledge of these variables at time t0, an MD calculation must start by assigning a set of initial values. The positions of ions are chosen to reflect the underlying crystal structure of the parent material. The values of the atomic position derivatives are usually assigned randomly, albeit subject to a normal distribution function.11 This generally presents no problem since most MD techniques also employ periodic boundary conditions. However, the method described here deals with a finite in-vacuo nanocluster having initial ion positions that are likely to be far from equilibrium. The random assignment of variables for such a cluster may (and does) cause ions on the periphery of the cluster to dissociate rapidly. To circumvent this problem, initial variables are generated via a recursive algorithm that uses the initial atomic positions to calculate the accelerations and then build the other variables.9
Once the model is initiated, the kinetic energy of the system is monitored and rescaled so that a target temperature is maintained. The scaling process is not trivial for materials with ionic species having different masses.9 Once the rescale factor for each type of ion is sufficiently close to 1, the rescale is turned off and the "production run" begins. Clearly, this type of calculation is not computationally complex. To obtain meaningful results, however, we find that for a cluster of around 500 ions, the numerical procedure involves approximately 100,000 time steps and generates close to 108 floating-point numbers of trajectories of the particles.12
The integrity of the interior ions can be confirmed using Fourier analysis. Here, the Fourier transform is defined by
 drexp(ikr)D(r)
DIFFUSION RATES
As LaF3 undergoes a superionic transition, the diffusion of ions in the material is of particular interest. An appropriate tool for investigating ionic mobility is the mean square displacement (MSD):
 ra(t)2> = «|rai(t + t0) - rai(t0)|2»
Here, < ra(t)2> is the MSD for ions of species
  , rai(t) is the position of ion, i, of species
  , and «...» denotes an average over all ions of the appropriate species and over all starting times t0. The MSD at long times is related to the diffusion coefficient by:15
 ra(t)2> = Ba + 6Dat
where Da is the diffusion coefficient for species  , and Ba is vibrational MSD.
Surface and Bulk Ions
Because the clusters considered are small, a significant fraction of the ions in the cluster are located in the surface layer, not in the bulk (almost 50 percent for the 552 ion cluster). This suggests that an average over all the ions in the cluster will result in an average of the bulk and surface ion diffusion. However, since bulk and surface ions are located in different environments, they may be expected to have different transport properties.
 |
| Figure 5. The first procedure. |
 |
| Figure 6. The second procedure. |
First Procedure
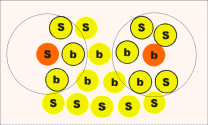
Count the number of neighbors of each ion that are inside a sphere of some fixed radius. A reasonable choice of sphere radius is one that includes all the nearest neighbors in the bulk perfect crystal. If the number of ions inside this sphere is greater than some fixed number, for example two thirds of the number of nearest neighbors in ideal crystal, then this ion is considered a bulk ion; otherwise, it is considered a surface ion. This procedure is qualitatively illustrated in Figure 5.
Second Procedure
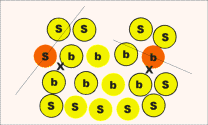
Locate N neighbors of each ion, where N is the number of nearest neighbors in the bulk perfect crystal. For ions in the bulk, these neighbors will all be distributed around the ion being analysed. For a surface ion, these neighbors will be predominantly on one side of the analysed ion (the inside of the cluster). For a more rigorous definition of the phrases "all round" and "on one side," the neighbors are divided into two groups by a plane that passes through the ion being analysed; it is orthogonal to the line connecting this ion to the center mass of its neighbors. The ion is then considered as a surface ion if almost all its neighbors (say 75 percent) are on one side of the plane and are otherwise bulk. This approach is illustrated in Figure 6.
 |
| Figure 8. Diffusion coefficients for La3+ and F- ions calculated from the slope of MSD graphs. |
Figures 7a-7h show the MSD as a function of time for several temperatures (i.e., 530 K, 650 K, 770 K, 885 K, 1,100 K, 1,290 K, 1,480 K, and 1,690 K). At all temperatures, the graphs show, as expected, that the heavy La3+ ions are less mobile then the F- ions. In addition, La3+ bulk ions are less mobile than La3+ surface ions. Similary, below 800 K, F- surface ions are more mobile than bulk ions. This corresponds to our intuitive expectations about surface ions as particles with more freedom to move than ions in the bulk. At a temperature of about 800 K, however, there is an inversion of this expected pattern, and F- ions in the bulk start to move faster than F- ions on the surface. This counter-intuitive behavior persists up to 1,700 K, when the cluster melts.
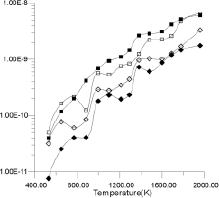
Figure 8 shows the diffusion coefficients for La3+ and F- ions calculated from the slope of MSD graphs. It is clear that the bulk diffusion coefficient for F- ions is larger than for surface diffusion over a wide range of temperatures (800-1,700 K). Conversely, the relationship between surface and bulk diffusion for La3+ remains normal over the whole temperature range. Figure 8 also shows sharp increases in diffusion coefficients at about 900 K and 1,300 K (1,100K is usually considered to be the superionic transition temperature of LaF3).16,17
VAN HOVE AUTOCORRELATION FUNCTION
To refine the observation of anomolous behaviour in F- mobility, a van Hove autocorrelation function was calculated:
 (r,t) = «
 (rai(t + t0) - rai(t0)))»
This function represents the probability for a particle of species  to make a displacement, r, in time, t; «...» again denotes the average over all the ions and all starting times, t0.
 (r,t) for bulk ions; the right side graphs Gs
 (r,t) for surface ions. The graphs show only one sharp peak at temperatures below 770 K, which corresponds to the local oscillations of ions. However, the bulk F- van Hove autocorrelation function shows a second peak of 2.5 Angstroms at 770 K, which corresponds to a jump of F- ions to a position between two regular lattice sites (i.e., interstitial). This result is consistent with lattice energy minimization calculations and experiments, which suggests that Frenkel defects are the dominant mode of disorder in LaF3.17 When the temperature increases to 885 K and 1,100 K, the amplitude and width of this second peak in the F- distribution increases, whereas the distribution for surface F- and both bulk and surface La3+ remains unimodular. At higher temperatures, all the graphs (not included here) of the van Hove autocorrelation function became broader and revealed no visible multimodular structure. This behavior of the van Hove function implies that, over the wide range of temperatures starting at about 800 K, F- ions exhibit hopping mobility, with surface F- ions and La3+ ions remaining essentially immobile.
Based on these findings, it is possible to suggest an explanation for the unexpected predominance of bulk F- diffusion over surface diffusion at temperatures above 800 K. Clearly, ions at the surface have more potential physical space, because of the absence of neighbors that would have been present in the bulk. Thus, at low temperatures, when ions are essentially vibrating around an average position, the surface ions are free to move over larger distances and their MSD's are larger than those for bulk ions. However, the absence of a complete F- ions shell around La3+ ions, close to the surface, means that surface F- ions experience a higher electrostatic potential. Consequently, surface F- ions are trapped in a deeper well, and the activation energy for their migration is larger than that for bulk F-. This would explain why at 770 K and 885 K (Figure 9b and Figure 9c, respectively), a second peak is clear in the van Hove function for bulk F- ions but not for surface F- ions.
FLUORINE SUBLATTICE DISORDER
Since only the F- ions are mobile, it is tempting to expect that the transition in ion mobility is associated with F sublattice disorder. In Figure 10, however, the Fourier analysis of the F- sublattice at 850 K shows that it is still ordered. As the temperature increases further, the F- ions do eventually became disordered, but the disorder occurs over a wide temperature range starting at 1,000 K. Figure 11 shows the Fourier transform of the F- sublattice at 1,300 K. Figure 12 presents the Fourier transform of the La3+ sublattice, showing that the latter is still ordered.
Finaly, at temperatures near 1,700 K, the La3+ sublattice becomes disordered, and LaF3 melts. The experimental melting point is 1,766 K.16
 |
| Figure 13. Displacements for a number of F- ions as a function of time at a constant temperature of 770 K |
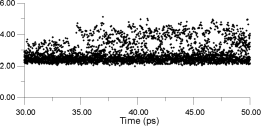
Figure 13 shows displacements for a number of F- ions as a function of time at a constant temperature of 770K. The ions are choosen in the following way. First, the whole cluster is heated to a target temperature and equilibrated for 30 ps. Next, a bulk La3+ ion is selected, and the surrounding F- ions within a radius of 3 Angstroms are identified. The positions of these neighbours are monitored over the next 20 ps, so that the y-axis shows how far these ions have moved with respect to their parent La3+ ion. Thus, it is the F- - La3+ distance that is being monitored. Almost immediatelly after monitoring begins, some F- ions move into sites, which can be identified as being interstitial by their displacement value of 3.5 Angstroms. Some time later, ions are able to move to 4.3 Angstroms, at which distance they should be occupying second-neighbor positions with respect to the original La3+ ion.
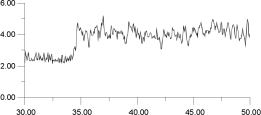
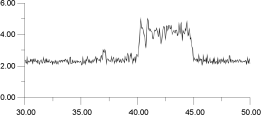
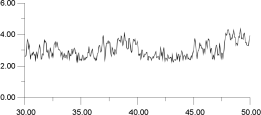
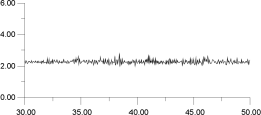
In Figure 14, the displacements of four of the F- ions depicted in Figure 13 are analysed individually. It is clear that the top two ions (Figures 14a and 14b) have undergone a hopping process, with the second ion (Figure 14b) actually hopping back into its original site. The third ion (Figure 14c) seems to oscillate back and forth within an interstitial site; the fourth ion (Figure 14d) maintains its association with the original La3+. This analysis suggests that the movement of ions within the lattice occurs via two different sites and, therefore, at least two mechanisms.
 |
 |
| Figure 14a. | Figure 14b. |
 |
 |
| Figure 14c. | Figure 14d. |
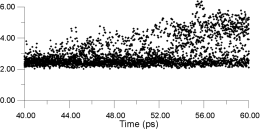 |
| Figure 15. Constant temperature analysis carried out for the cluster at 1,300 K. More finely analyzed in Figure 16. |
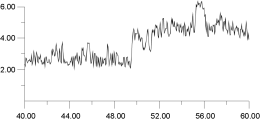
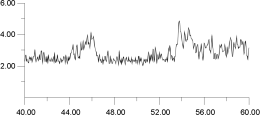
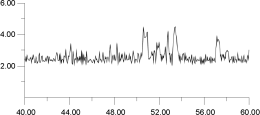
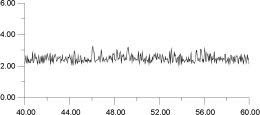
A similar constant temperature analysis was carried out for the cluster at 1,300 K and is shown in Figure 15 and Figure 16. Again, by deconvoluting the ion migration into individual contributions, it is clear that migration occurs via a hopping mechanism. This occurs despite the fact that, at 1,300 K as Figure 12 shows, the F- sublattice has become disordered. Indeed, Figure 16 shows that the first F- undergoes two hops; thus, for a short time, it actually occupies a third neighbor position with respect to its original F- parent ion. These results suggest, surprisingly, that, at least within the time scale adopted here, the disordering of the F- sublattice does not have a strong effect on the mode of ion migration.
From this type of analysis, it is possible to derive a physical picture of the migration process. However, the versitility of the World Wide Web also allows us to consider the process dynamically. Hence, Figure 17 shows an La3+ ion and its 12 nearest neighboring F- ions (the subjects of analysis in Figure 16). By analyzing the trajectories of only these ions, it is possible to view their motion without the motion being obscuring by the remaining lattice; it is, of course, still subject to forces from all the other ions in the lattice (which are also in motion). Thus, Figure 17 is equivalent to Figure 16.
 |
 |
| Figure 16a. | Figure 16b. |
 |
 |
| Figure 16c. | Figure 16d. |
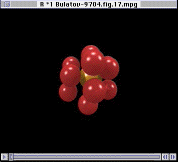 |
Figure 17 quite illustrates the hopping motion model proposed for F- ions migration through the lattice. However, it also shows that, at one point toward the end of the video clip, many of the ions hop at approximately the same moment; this occurs via a concerted process. Now that we are aware that this type of process occurs, we must derive the analysis tools necessary to assess its overall importance in the migration process.
CONCLUSIONS
The simulations described in this article show that the diffusion of fluorine ions in LaF3 at temperatures above the superionic transition has an unexpected behavior: the diffusion coefficient of F- ions in the bulk of the cluster is several times larger than that of the surface ions. Both the MSD and the van Hove autocorrelation function analysis support this conclusion. Furthemore, although the F sublattice becomes disordered at 1,100 K, ion migration is facilitated by a hopping mechanism or mechanisms that are mediated by at least one interstitial and one lattice site. Finally, two different sites may be involved in the migration process.
These results, particulary the observed unexpected predominance of bulk diffusion over surface diffusion, have important consequences for the interpretation of fast ion diffusion in crystals with a high density of grain boundaries. We suggest that under certain circumstances, diffusion along grain boundaries will be much slower than in the bulk of grains. If this can be verified experimentally, it will lead the way toward improving fast ion conduction by modifying grain boundary structure in such a way that the disruption to the bulk structure is minimal. In this task, similar simulation studies as presented here would be of great value.
References
1. J.P.Rose and R.S. Berry, J. Chem. Phys., 96 (1992), p. 517.
2. J.P.Rose and R.S. Berry, J. Chem. Phys., 98 (1993), p. 3262.
3. T.L. Hill, Thermodynamics of Small Systems, (Benjamin, 1963 and 1964)
4. R.M. Lynden-Bell, Mol. Phys., 86 (1995), 1353.
5. S. Bjornholm, Contemporary Physics, 31 (1990), p. 309
6. T.P. Martin Surface Science, 106 (1981), p. 79.
7. M. Born and A. Land, Verhandl. Deut. Physik Ges., 20 (1918), p. 210.
8. V.L. Bulatov, R.W. Grimes, and A.H. Harker, submitted to J. Phys. Condensed Matter.
9. A. Dornford-Smith and R.W. Grimes, Phil. Mag., 72 (1995), p. 563.
10. C.W. Gear, Argonne National Laboratory Report ANL 7126 (Illinois: Argonne National Laboratory, 1966).
11. M.P. Allen and D.J. Tildesley, Computer Simulation of Liquids (Oxford, U.K.: 1987).
12. V.L. Bulatov and R.W. Grimes, "Visualization of Molecular Dynamics Simulations," Eurographics UK, 1 (1996), p. 83.
13. D.J. Binks, R.W. Grimes, A.L. Rohl, and D.H. Gay, J. Mat. Sci., 31 (1996), p. 1151
14. S. Vyas, Ph.D. thesis, University of London (1996).
15. J.-P. Hansen and I.R. McDonald, Theory of Simple Liquids (Academic Press, 1986).
16. W.G. Lyon, D.W. Osborne, H.E. Flotow, F. Grandjean, W.N. Hubbard, and G.K. Johnson, J. Chem. Phys., 69 (1978), p. 167.
17. P.E. Ngoepe, J.D.Comins, and A.G.Every Phys. Rev., B34 (1986), p. 8153.
18. W.M. Jordan and C.R.A. Catlow, Cryst. Latt. Def. and Amorph. Mat., 15 (1987), 81-87.
For more information, contact V.L. Bulatov, Oregon State University, 301 Weniger Hall, Corvallis, Oregon 97331-6705; (541) 537-1712; e-mail bulatov@dots.physics.orst.edu.
Direct questions about this or any other JOM page to jom@tms.org.
| Search | TMS Document Center | Subscriptions | Other Hypertext Articles | JOM | TMS OnLine |
|---|