http://www.tms.org/pubs/journals/JOM/9909/Mehta/Mehta-9909.html
| |
http://www.tms.org/pubs/journals/JOM/9909/Mehta/Mehta-9909.html
| |
| TABLE OF CONTENTS |
|---|
It is almost impossible to design a streamlined/shaped die to a very complex profile and manufacture the extrusion die; the conventional approach is to design a shear die. Although shear dies are ideal for materials like aluminum, there are some disadvantages to using this conventional approach with composites, polymers, and certain alloys, which work better with streamlined or shaped dies. In these cases, STREAM, a streamlined die-design package, can allow smooth and streamlined material flow, a more homogeneously deformed product, lower pressure loads, and no intense shear band. It is only limited for designing simple and somewhat symmetrical-shape dies. Shear or flat-face dies, which can be designed by the SHEAR die-design package, can have any kind of complex geometric shape. Usually extrusion is carried out at a very high temperature, and in the case of shear or flat-face dies with intense shearing of metal, there are possibilities of adiabatic heating and hot shortness occurring.
| DESIGN OF EXPERIMENT |
|---|
| A designed experiment is the simultaneous evaluation of two or more factors (parameters) for their ability to affect the resultant average or the variability of a particular product or process characteristics. To accomplish this in an effective and statistically proper fashion, the levels of the factors are varied in a strategic manner, the results of the particular test combinations are observed, and the complete set of the results is analyzed to determine the influential factors, preferred levels, and whether an increase or decrease of those levels will potentially lead to further improvement.4 It is important to note that this is an iterative process; the first round through the design-of-experiment (DOE) process will, many times, lead to subsequent rounds of experimentation. The beginning round, often referred to as a screening experiment, is used to find the few important, influential factors out of the many possible factors involved with a product or process design. This experiment is typically a small experiment with many factors at two levels.4
As opposed to using trial-and-error methods, experiments are designed to gain both effectiveness and efficiency in knowledge acquisition. Experimentation is necessary to gain or verify knowledge about a product or process. It can be performed in a number of ways, ranging from the trial-and-error ("one knob at a time") approach to a carefully planned multifactor experiment. The former has given way to the latter, because of its greater overall effectiveness in isolating main and interaction effects and/or components of variation, its efficiency in working with smaller sample sizes, and its timeliness in producing results. Hence, a designed experiment involves a systematic plan of investigation, based on established statistical principles, so that the interpretation of the observations can be defended.5 |
Extensive theoretical and experimental research has been carried out to improve die design and the flow of material through it. The most widely used techniques for flow analysis have been the finite-element technique, slab method, or the upper-bound technique. In three-dimensional analysis, the finite-element technique is very time consuming and requires some level of skill on the part of the user during meshing and analysis. The slab method is very inaccurate for complex geometries.
The improved upper-bound formulation3 incorporates the correction for the velocity profile and the slip at the wall using the friction coefficient. The modified method was coded using the C language, and the results were compared to the finite-element solution for the same die geometry. The improved upper-bound solution was significantly faster and compared well with the finite-element method. The improved solution will be incorporated into the existing STREAM package to replace the slab method currently employed.
In this model, the variation in the value of n was considered as a source of noise; the noise parameter was assumed to have two levels. For this kind of model, it is advisable to do the analysis using the FF. The main advantage of this method is the reduction in the number of experiments. In the FF, information is sacrificed on higher-order interactions. For example, consider an experiment with five variables. Using a full factorial, 25, 32 experiments must be conducted, including five main effects, ten second-order interactions, and 16 third and higher-order interactions. In FF, only the five main and the ten second-order effects are considered, while the third-order and higher-order interactions are neglected. One of the main advantages of the FF is that it is used mostly for screening (i.e., to determine the significant few from the insignificant many). The principles of screening are mostly represented in the projection and sequential experimentation. Through the projection, an FF can be projected into a stronger design within the subset of the significant factors, and through sequential experimentation, separate experiments can be combined to sequentially focus on interesting effects.
For defining the model, the form 2k-pres is used, where k is the number of variables, p is the number of generators, res is the resolution, and 1/2p is the friction.
A potential concern in the use of two-level factorial designs is the assumption of linearity in the factor effects. Perfect linearity is unnecessary, and the 2k system will work quite well even when the linearity assumption holds only very approximately.6 However, there is a method of replicating certain points in the factorial design that will provide protection against the existence of curvature and allow an independent estimate of error to be obtained. One important reason for adding the replicate runs at the design center is that the center points do not impact the usual effect estimates in the factorial design.
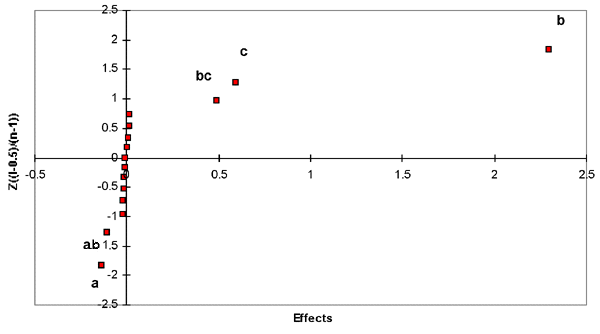 |
| Figure 1. The normal probability chart for Case 25-1. |
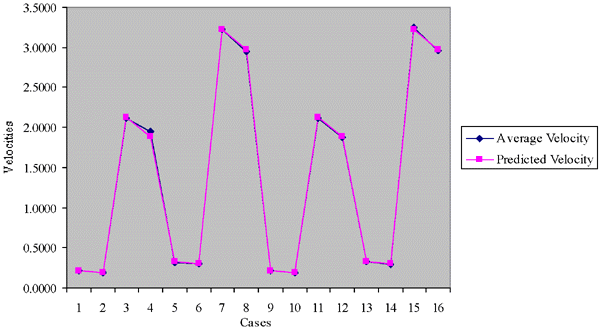 |
| Figure 2. The actual and predicted velocities chart of Case 25-1. |
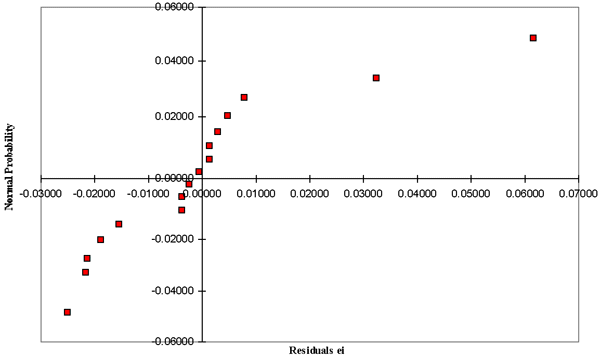 |
| Figure 3. The normal probability chart for the residuals of Case 25-1. |
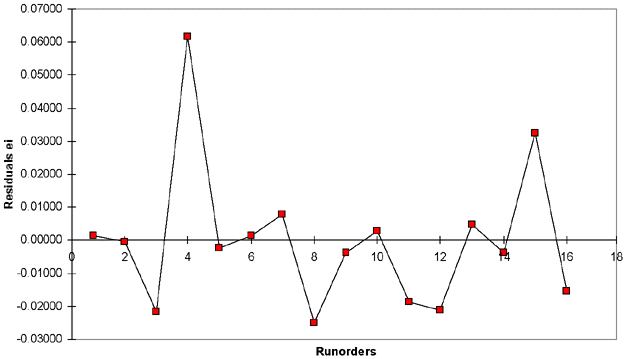 |
| Figure 4. The residuals vs. the run order of Case 25-1. |
A single-degree-of-freedom sum of squares for curvature (SScurvature) is given by
Where nF is the number of factorial design points, and nC is the number of the center points—in this case, one point.
The analysis was performed for the model of 25-1 with resolution V, meaning the model has five variables, each with two levels and one design generator. Based on the results of the 25-1 model, the next analysis was carried out for the model of 25-2 with resolution III, meaning that the model has five variables, each with two levels and two design generators.
In model 25-1, the design generator is I = ABCDE. Initially, the data were collected, formatted, and arranged as in Table I (–1 and +1 represent the noise due to variation in n), noting that the last row is for the center point. Yate's algorithm, a simple technique devised by Yates (1937) for estimating the effects and determining the sums of squares for the main effects and their interactions in a 2k factorial design,6 was used.
The first half of column one is Table II is obtained by adding the averages in adjacent pairs. The second half of the column is obtained by changing the sign of the first entry in each of the pairs in the average column and adding the adjacent pairs.6 Column two is obtained from column one, just as it is obtained from the average column. Similarly, column three is obtained from column two. Since there are four variables (where the fifth variable is represented in terms of the other four variables), four columns are needed. To obtain the estimates of the effect, the formula (4)/2k-1 for calculating the effect was used. Finally, the formula for calculating the sums of squares is (4)2/2k, where (4) means the value of the fourth column, and k = 4. To have a clear picture about the behavior of the model, the effects need to be normalized; hence, the normal probability of the effects has been arranged and plotted in Table III.
From the normal probability plot shown in Figure 1, the main significant effects are concluded to be a, b and c, and the interactions are ab and bc. The rest of the effects and the other interactions can be pooled to represent the error as shown in the analysis of variance (ANOVA). By including the center-point analysis in the model, it was found that yF = 1.4055637, yC = 1.571319, SScurvature = 0.0258357, nF = 16, and nC = 1.
From these determinations, Table IV was developed. The curvature has a significant contribution in the model statistically, but, a large difference is noticed between the curvature and the other significant parameters (in terms of any of the sum of squares of error, mean squares of error, or F values). So, the curvature exists, but it has a very small contribution to the model compared with the contributions of other significant parameters.
Table V shows the error analysis for this model; it is very clear that the accuracy of the outputs is very high by comparing the actual and the predicted outputs. Figure 2 shows the line chart for both the actual data and the predicted data.
For the residual (error) diagnostics, there are many different statistical tests. Two efficient diagnostic approaches were used here to check the residuals. The first approach is the normality diagnostics (Table VI and Figure 3), with the assumptions that the error is normally and independently distributed with mean 0 and variance s2, NID (0,s), and the variance s2 is constant for all levels, where
and N = 16.
The second diagnostics for the residuals is to check the error against the run order (Table VII and Figure 4). This test is mainly used for checking the nonexistence of any specific pattern in the residuals.
The outputs of the other model of 25-2 with resolution III and the design generators (I = ABD = ACE = BCDE) were almost the same, giving the same indications about the significant parameters. The effects were similar to the model with a resolution of five. The percentage errors from both analyses were quite low.
The DOE with FF helped in reducing the number of experiments to be performed and also identified the main parameters/effects. These parameters are more significant, and the neural network should be trained for them more precisely.
An ANN was designed based on the back-propagation paradigm to predict the force of the extrusion process for the straight converging dies. This ANN must be capable of high mapping-accuracy levels and must have fast execution speed. Executing the program for the improved upper-bound technique generated the data for the neural network. The data consist of many columns, where the first columns represent the inputs, and the last one represents their output. The input data are summarized in the following parameters: 1–the length of the die (L), 2–the radius of the entry of the die (r0), 3–the radius of the exit of the die (re), 4–the initial velocity for the billet (V0), 5–the number of the cross sections inside the die, 6–the value of n (for the material properties), and 7–the value of m (for the friction coefficient).
The data were collected for many different runs. In each set, there is a different combination of the input data. In each run, a number of cross sections were used; at each cross section, the die was divided into 11 different radii. The collected data had more than 8,000 records, each with a different combination of inputs and their corresponding output. The last stage in organizing the data was the randomization process. After full randomization, the randomized data were divided into two major sets–a learning set composed of 6,000 records and a testing set comprising 2,000 records.
The design of the ANN consists of many stages. The first stage is the training stage, where the learning data of a nonlinear mathematical model of the extrusion forces were utilized for training the neural network. In this stage, the neural-network architecture must be determined. Since there is no formula for selecting the most appropriate number of hidden layers, the optimal number of hidden layers must be found by trial and error. Several runs with a different number of hidden layers were made and the root-mean square (RMS) error for each was compared to find the optimum number of hidden layers. By monitoring the RMS error, the minimum RMS error was defined; thus, the optimal number of hidden layers was also defined. Training was done using the optimal number of hidden layers. In the second (testing) stage, the testing data set was utilized for testing the model, verifying the model, and checking the accuracy of the model (prediction). For testing the model accuracy, there are many different error indicators, which were used in the analysis, including
| Average Error = |  |
| Average Absolute Error = |  |
| Average Percentage Error = | 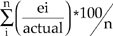 |
| Mean Square Error = |  |
| RMS Error = |  |
| Maximum Absolute Error = | Maximumabsei |
Where ei is the error of the ith point and absei is the absolute error of the ith point.
The results of the error indicators for the original neural network model (before the DOE) and the optimized model after the modification are shown in Table VIII. The table shows the significant improvement in the average error and the maximum absolute error values after the DOE. The two error indicators–the most important indicators–decreased after the DOE analysis using the new data set.
Since the area ratio is actually representing the diameter ratio, another comparison in terms of error indicators was done between the different error indicators for the three models (Table IX). This comparison was done for several reasons. First of all, it checked the validity of each of the three models and provided an idea about the accuracy of each of the models as compared with the other. Second, it determined whether the area ratio has the same effect as the diameter ratio. Also, the comparison proved that the DOE model cannot be as accurate as the neural-network model when the DOE model considers the linearity and the neural-network model has the ability to learn the behavior of the models through statistical training (can be nonlinear prediction).
References
1. E.M. Mielnik, Metalworking Science and Engineering (Toronto: McGraw-Hill, 1991).
2. P. Gosavi, "Design of Part Conical-Part Streamlined Extrusion Dies and a GUI User Interface" (M.S. thesis, Ohio University, 1996).
3. H. Ghulman, "An Improved Upper Bound Method for Flow Analysis in Converging Extrusion Dies" (M.S. thesis, Ohio University, 1996).
4. P.J. Ross, Taguchi Techniques for Quality Engineering, 2nd ed. (New York: McGraw-Hill, 1996).
5. W.J. Kolarik, Creating Quality Concepts, Systems, Strategies, and Tools (New York: McGraw-Hill, 1995).
6. D.C. Montogomery, Design and Analysis of Experiments (New York: John Wiley & Sons, 1991).
Bhavin V. Mehta is an associate professor and Hamza Ghulman is a research associate in the Department of Mechanical Engineering, and Rick Gerth is an associate professor in the Department of Industrial & Manufacturing Systems Engineering at Ohio University.
Direct questions about this or any other JOM page to jom@tms.org.
| Search | TMS Document Center | Subscriptions | Other Hypertext Articles | JOM | TMS OnLine |
|---|