|
Heterogeneous deformation, including
local dislocation shear activity
and lattice rotation, was analyzed in
microstructure patches of polycrystalline
commercial purity titanium
specimens using three different experimental
methods. The measurements
were compared with crystal plasticity
finite element simulations for the same
region that incorporate a local phenomenological
hardening constitutive
model. The dislocation activity was
measured using techniques associated
with atomic force microscopy, confocal
microscopy, three-dimensional x-ray
diffraction, and nano-indentation. The
results indicate that a major challenge
for model development is to effectively
predict conditions where slip transfer
occurs, and where geometrically necessary
dislocations accumulate.
INTRODUCTION
| HOW WOULD YOU... |
…describe the overall significance
of this paper?
Crystal plasticity finite element
constitutive models with
phenomenological hardening
rules are insufficient to predict
the evolution of heterogeneous
deformation that precedes damage
nucleation near grain boundaries.
…describe this work to a
materials science and engineering
professional with no experience in
your technical specialty?
The mechanisms that govern
dislocation and twin interactions
with grain boundaries (slip transfer
rules) need to be identified so
that models can be developed,
implemented, and validated.
…describe this work to a
layperson?
This research program seeks to
discover how a crack becomes a
crack when there was no crack
before. With this knowledge,
improvements in material
performance can be developed for
a wide range of applications.
|
Titanium and its alloys are widely
used because of their high stiffness,
strength, and corrosion resistance.
However, the processes of heterogeneous
plastic deformation and fracture
initiation in hexagonal α-titanium
are still not well understood. Heterogeneous
deformation usually results
from two phenomena.13 One is that
some grains are much more easily
deformed than other grains, because
one or more deformation systems in
the "soft" grains can be more easily
activated than those in "hard" grains
under an imposed stress state, leading
to large strain differences among soft
and hard grains. The other aspect is the
heterogeneous deformation associated
with strain gradients within a given
grain, resulting from the requirement
for local arbitrary grain shape changes
needed to achieve polycrystalline compatibility.
A prominent feature of the plastic
deformation of hexagonal α-titanium is
the plastic anisotropy arising from four
types of dislocation slip systems with
various critical resolved shear stresses
(CRSS).4,5 The primary slip system is
{10 10} <1210> prismatic slip because
it has the lowest critical resolved
shear stress.4 There are three other
slip systems, {0001} <1210> basal,
{10 11} <1210> pyramidal slip,
and {10 11} < 2113> pyramidal
slip, that can be activated with high resolved
shear stress. There are also four
twinning systems in α-titanium6 that
can contribute to deformation, two tensile
(extension) twinning modes (T1
and T2), and two compressive (contraction)
twinning modes (C1 and C2).
During tensile tests at room temperature,
{10 12}<1011> T1 twinning is
commonly observed, in part due to its
relatively low magnitude of shear.6
The crystal plasticity finite element
(CPFE) method is often used to simulate
the three-dimensional (3D) plastic
deformation processes in polycrystalline
materials, because heterogeneous
deformation between and within grains
can be simulated.710 Crystal plasticity
finite element modeling incorporates
the crystallographic nature of dislocation
slip into the finite element method
by assuming that the plastic velocity
gradient is composed of the shear
contributions of all slip systems.11,12
Simulation of grain patches using the
CPFE method, however, are not always
able to match experimental observations.12,13
| Experimental and Analytical details |
Authors' Note: Certain commercial equipment, instruments, software, or materials are identified in this
paper to foster understanding. Such identification does not imply recommendation or endorsement by
the National Institute of Standards and Technology, nor does it imply that the materials or equipment
identified are necessarily the best available for the purpose.
Crystal plasticity finite element
constitutive models with
phenomenological hardening
rules are insufficient to predict
the evolution of heterogeneous
deformation that precedes damage
nucleation near grain boundaries.
A four-point bend specimen with dimensions of 25 mm × 3 mm × 2.5 mm was cut 45°
from the rolling direction of a commercially pure titanium plate with average grain size
of about 80 µm and a moderately strong texture (about 8 times random). X-ray diffraction
studies prior to deformation indicate that the grains generally contain a low number
of dislocations.14 The specimen surface was mechanically polished prior to deformation,
ending with a 0.05 µm colloidal silica suspension. The specimen was then deformed to
surface strain steps of about 1.5%, 3%, and 6%. Regions of interest were located near the
center of the sample surfaces, where a continuum finite element method (FEM) stress
analysis with isotropic properties showed that the stress state was uniaxial tension.15 The
grain morphology, grain orientations, and deformation slip lines were investigated before
and after deformation using a Camscan 44FE scanning election microscope with a TSL/
Link electron backscattered diffraction system. Tapping mode atomic force microscopy
measurements were conducted using a Dimension 3100 produced by Digital Instruments.
A Leica ICM 1000 scanning laser confocal microscope using a 635 nm red laser and 50
nm height increments was used to measure the surface topography after deformation. The
3D-XRD was accomplished using the differential aperture x-ray microscopy facility on
beam line 34-ID-E at the Advanced Photon Source at Argonne National Laboratory.
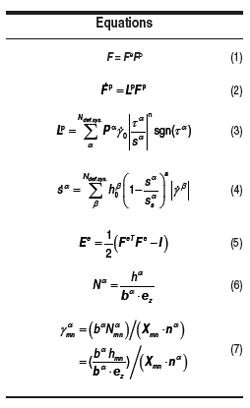
The crystal plasticity constitutive framework is based on a formulation using the multiplicative
decomposition of the total deformation gradient and considering the anisotropic
elastic constants of α-titanium, which are discussed in detail in References 16–18. The
deformation gradient, denoted as F, is decomposed into two parts in a finite deformation
framework, the elastic, Fe, and plastic ,Fp:, gradients, Equation 1. (All equations are
presented in the Equations table.) The evolution of the plastic gradient, Fp, is given by
Equation 2, where the plastic velocity gradient, Lp, resulting from activity on all deformation
systems is described as Equation 3 with Pα = mα ? nα as the Schmid matrices with
respect to the undeformed state, γ0 = 10-3 s-1 as reference shear rate, n the constant stress
exponent, tα the resolved shear stress, and sα is the shear resistance. The evolution of sα
during deformation is written as Equation 4. The resolved shear stress tα = Pα : S, where S
is the second Piola–Kirchhoff stress S = C : Ee. C is the fourth order tensor of linear elastic
moduli and the elastic strain Ee is obtained from the elastic deformation gradient as Equation
5, with I the second-order identity tensor. The quantities h0
ß, a, and ss
α are the three
hardening parameters. Mechanical twinning was implemented as unidirectional shear with
slip resistance properties similar to basal slip. The parameters used were initially chosen
from previous studies18 and then adjusted slightly to obtain better agreement with experimental
characterization and to enhance numerical stability. These parameters have been
more recently adjusted to include latent hardening and used in conjunction with conical
indentation experiments, following the methods described in References 19 and 20. The
crystal plasticity formulation was integrated into the commercial FEM system MSC.Marc.
|
To further understand and eventually
better simulate the heterogeneous
deformation processes in polycrystalline
α-titanium, this research project is
focused on both detailed experimental
characterization and the CPFE modeling
of heterogeneous deformation
using a phenomenological CPFE constitutive
model. Several experimental
characterization techniques, including
atomic force microscopy (AFM), confocal
microscopy, three-dimensional
x-ray diffraction (3D-XRD), and nano-
indentation, were used to quantitatively
measure the active deformation
systems in grains with different orientations.
The critical resolved shear
stresses (CRSS) of prismatic, basal,
and pyramidal slip are important
constitutive parameters for the CPFE
model. These values were identified by
optimizing the CRSS values in simulations
of the topographic pile-ups surrounding
conical nano-indentations in grain interiors using the same phenomenological
CPFE model. By comparing
experimental results with CPFE simulations
from the same grain patches,
along with careful study of dislocation
interactions at grain boundaries using
3D-XRD, the accuracy of the phenomenological
model was assessed. From
this, developments required to improve
modeling strategies have been identified.
See the sidebar for experimental details.
Deformation
Microstructure
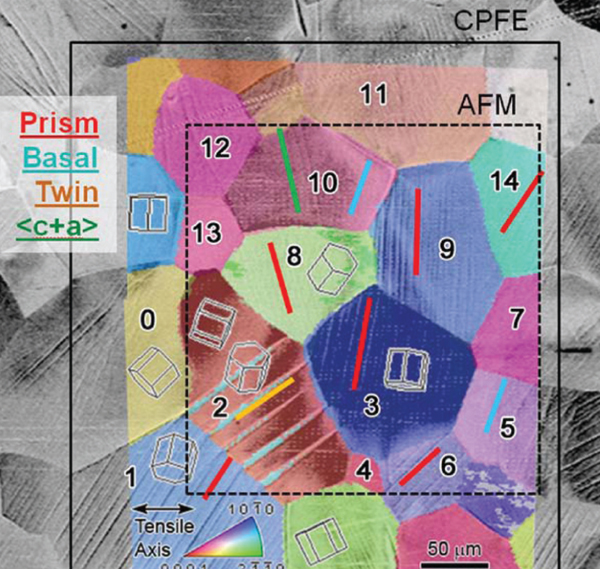
Figure 1 shows a backscattered electron
micrograph with a superposed orientation map that illustrates a patch
of microstructure after 1.5% plastic
strain. Two overlaid frames identify regions
that were examined using AFM
(dashed lines) and simulated with
CPFE (solid line). The free surface topography
shows slip traces that vary
from grain to grain, due to the differences
in crystal orientation (most visible
in grains 0, 1, 9; higher resolution
images clearly show traces parallel to
the colored lines that identify slip traces).
The activated deformation systems
were identified using trace analysis,21
based on the backscattered electron
(BSE) images and electron backscattered
diffraction (EBSD) to determine
grain orientation. Prismatic, basal, and
pyramidal slip, as well as T1
twinning, were found in this patch, as
denoted by the trace colors in Figure 1.
CPFE Simulation
The mesh for the CPFE model was
generated based on the two-dimensional
geometry EBSD map of the undeformed
patch. A 3D mesh was generated
by extending the two-dimensional
geometry into a five-element thick
slab, so that the grain boundaries were
perpendicular to the surface. A pan-like
rim, with an orientation that is at the
center of the dominant macro-texture
component, provided a somewhat realistic
bulk constraint to the modeled
region. Deformation was imposed by
constraining the left side of the pan to
zero displacement, and putting a face
load to the right.
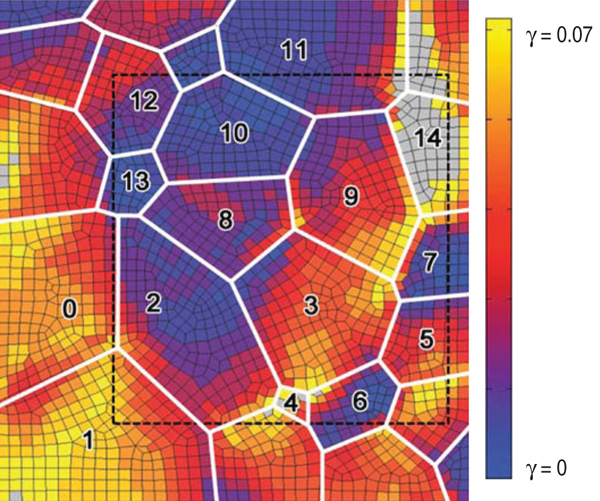
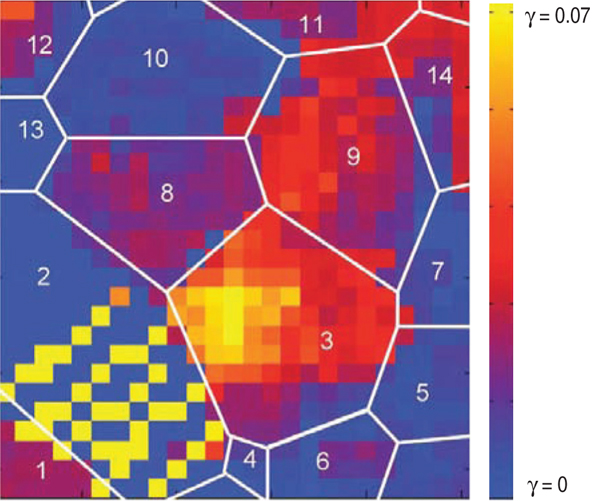
The local shear distribution in the
microstructure patch from all dislocation
slip systems at 1.5% plastic
strain is quite heterogeneous, as shown
in Figure 2. The CPFE simulations
showed that the highest shear occurred
in grain 14, caused by prismatic slip.
Prism slip was dominant in grains 1,
3, and 9, with the local shear ranging
from 0.05 to 0.07. Basal slip was observed
in grains 5, 7, and 10, but with
smaller magnitudes, from 0.005 to
0.02. No significant pyramidal
slip occurred in the simulation of this
microstructure patch. T1 twinning activity
dominated the deformation in the
lower part of grain 2.
Experimental
assessment
To quantitatively assess the accuracy
of the simulation results, comparisons
were made with direct experimental
measurements of the local shears
arising from dislocation activity in
the microstructure patch. A technique
combining AFM and EBSD-based
trace analysis was recently developed
to quantitatively measure the local dislocation
shear activity associated with
activated deformation systems in different
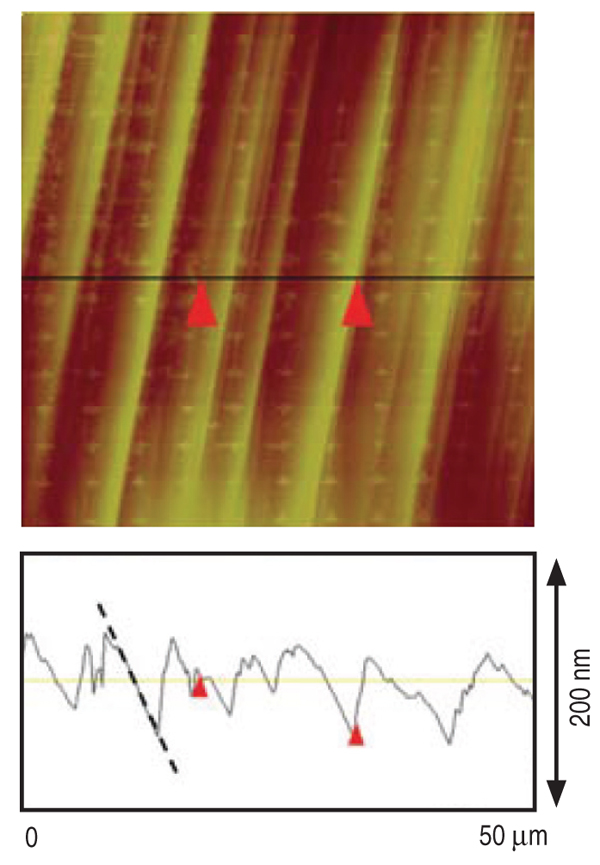
grains.14 Figure 3 displays a high
magnification BSE image of an example
of dislocation slip lines, as well as
an AFM image of the same area measuring
the surface height change due to
the slip lines.
Based on the measurement of surface height change (h), the number of
slip/twinning dislocations shearing a
given volume of material can be calculated
as Equation 6 where Na is the
number of dislocations, ba is the Burgers
vector of the identified deformation
system, a, using trace analysis, and ez
is the normal to the sample surface.
The microstructural patch was subdivided
into a 25 × 25 array of 10 μm tiles
indicated by indices m,n, each of which
was scanned by AFM. AFM section
lines similar to that shown in Figure 3
were collected along the centerline of
each tile, and the local shear (ga
mn) associated
with each deformation system
α was calculated as Equation 7 where
nα is the plane normal of deformation
system α and Xmn is a vector pointing
along the scan line with a constant
length of 10 mm.
The local shear maps at 1.5% strain
generated from AFM data (Figure 4)
indicate that the simulation successfully
predicted the presence and magnitude
of most of the active dislocation
slip and twinning systems. The highest
shear value in the simulation is about
the same as that measured using AFM
for most of the grains (2, 3, 6, 8, 9, 10,
and 13) in the center of the patch. However,
the spatial distribution of simulated
local shear is frequently different
from the experimental measurement.
In grain 3, the CPFE model showed the
highest shear in the lower right of grain
14 rather than to the left of center. Also,
near the boundary between grains 3 and
8, the shear caused by prismatic slip in
grain 3 is about 0.05 to 0.07, which is
lower in the simulation. In contrast,
the basal shear activity in grains 5 and
7 varied from 0.005 to 0.02, which is
modeled accurately in terms of magnitude
and distribution. For grain 10,
the CPFE simulation successfully captured
the basal activity both spatially
and quantitatively, but did not predict
the pyramidal slip activity in the
right side of this grain. Since the shear
contribution of twinning was only simulated
as a homogeneous unidirectional
slip system, the localized twins in grain
2 could not be captured properly. Thus,
the shears caused by twinning are diffuse
rather than spatially concentrated,
so the magnitude can only be semi-quantitatively
compared to the experiment.
Given this, the twin shear was
distributed in a spatially similar way
along the lower left grain boundary, but
did not extend into the grain interior.
In a concurrent study, the use of
scanning laser confocal microscopy to
measure quantities similar to that obtained
by AFM is under investigation
with characterization following ≈6%
global strain. At this strain, the twins
grew sufficiently thick to nearly merge
with each other on the side next to grain
1, but remained tapered on the side next
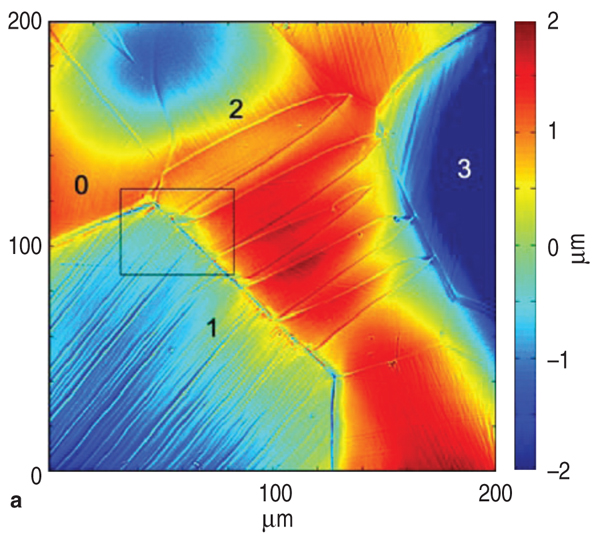
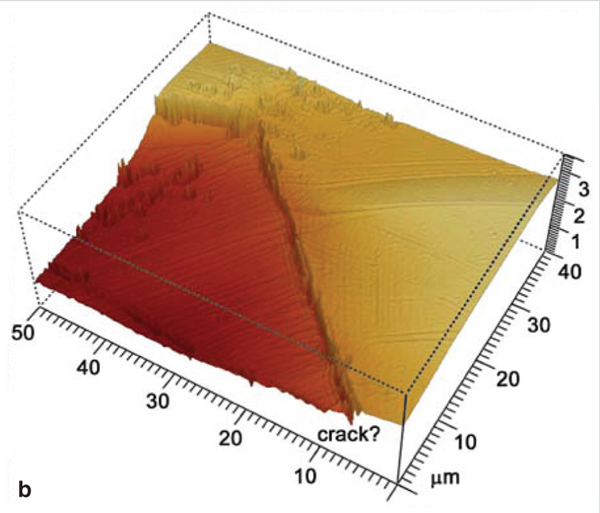
to grain 3. Figure 5 shows a topographic
representation of the neighborhood
of grains 1, 2, 3 that indicates how the
harder grain 2 resisted deformation (it
has the highest topographic elevation)
while grains 1 and 3 sunk due to being
more highly strained. The twin topography
is also evident, as the upper side
has a higher elevation than the lower
side in each twin. Clearly the influence
of deformation in grains 0 and 1
affect deformation in grain 2, as the
upper part of grain 2 has a depression
that indicates that a greater amount of
local strain has occurred. Figure 5b illustrates
in higher magnification the
region where the twins nucleated at
the boundary between grains 1 and 2,
which shows an additional depression
along the grain boundary that may be
the beginning of a crack. Further deformation
will be imposed and the continuing
evolution of deformation and
damage in this region will be reported
in a future paper.
Nano-indentation
characterization and
CPFE parameter
optimization
An efficient way to improve the
existing CPFE model is to more accurately
determine the critical resolved
shear stress (CRSS, or sa) and hardening
parameters of deformation systems
using single crystal experiments. However,
for hexagonal metals it is difficult
to use conventional uniaxial tensile
tests of single crystals to measure the
CRSS. This is because the wide range
of CRSS values for the different deformation
system types makes it difficult
to isolate specific systems without activating
other systems with lower CRSS.
Nano-indentation experiments combined
with CPFE simulations provide
an alternative opportunity to study the
behavior of single crystals in a polycrystalline
environment. Because in
most cases the grain size is much larger
than the size of the indentations, nanoindention
can be treated as the deformation
of a constrained single crystal.
Such experiments allow the separation
of the influence of intrinsic grain properties,
such as grain orientations, from
the influence of polycrystallinity such
as interfaces and neighboring grain
orientations. A study of the anisotropic
nano-indentation response of a-titanium
was conducted to quantitatively
identify the CRSS for different slip
systems.19,20
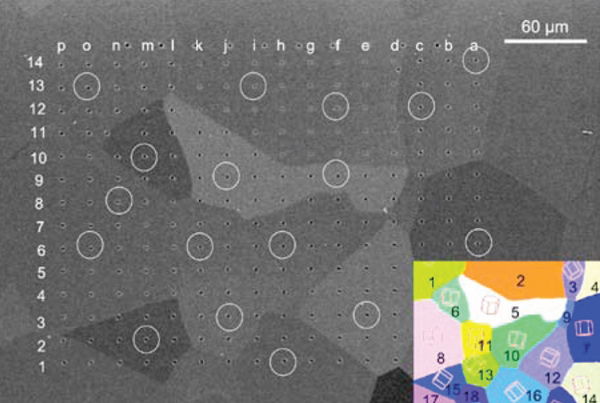
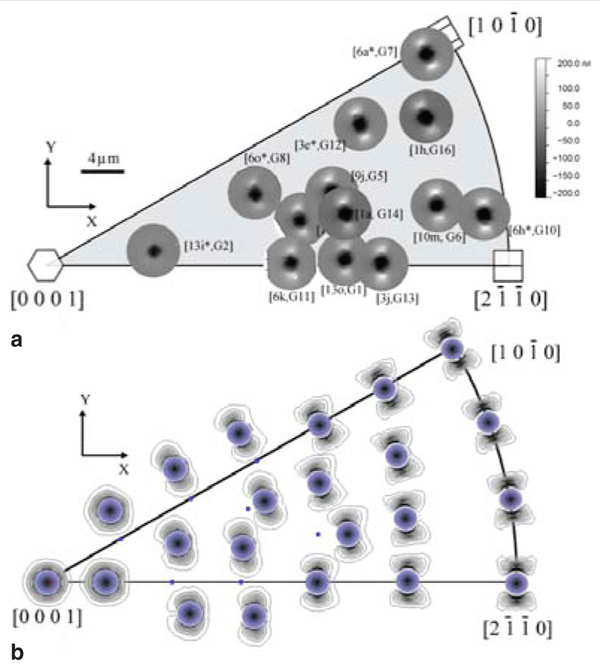
 Based on a large-area EBSD scan,
a suitable microstructure patch in another
specimen from the same plate
was chosen to provide a variety of
crystallographic orientations for nanoindentation,
as shown in Figure 6.
These indentations were carried out using
a spheroconical diamond tip with a
nominal tip radius of 1 μm and a nominal
cone angle of 90°. Load-controlled
indentations were performed with a
maximum load of 6 mN. Residual surface
topography of selected indents in
the middle of each grain (to avoid grain
boundary effects) were measured by
AFM. Figure 7a displays the residual
pile-up topographies as measured by
AFM positioned on an inverse pole
figure of the indentation direction. The
indentation data and the indent sizes
show that the [0001] indentation axis
is the hardest direction, as the residual
impressions are shallower than in other
orientations. For indentation axes away
from the [0001] direction, two dominant
pile-up hillocks are always formed
on opposite sides of the impression. No
twins were found in EBSD scans after
indentation, and the AFM topographies
showed no twin-shaped surface features. Based on a large-area EBSD scan,
a suitable microstructure patch in another
specimen from the same plate
was chosen to provide a variety of
crystallographic orientations for nanoindentation,
as shown in Figure 6.
These indentations were carried out using
a spheroconical diamond tip with a
nominal tip radius of 1 μm and a nominal
cone angle of 90°. Load-controlled
indentations were performed with a
maximum load of 6 mN. Residual surface
topography of selected indents in
the middle of each grain (to avoid grain
boundary effects) were measured by
AFM. Figure 7a displays the residual
pile-up topographies as measured by
AFM positioned on an inverse pole
figure of the indentation direction. The
indentation data and the indent sizes
show that the [0001] indentation axis
is the hardest direction, as the residual
impressions are shallower than in other
orientations. For indentation axes away
from the [0001] direction, two dominant
pile-up hillocks are always formed
on opposite sides of the impression. No
twins were found in EBSD scans after
indentation, and the AFM topographies
showed no twin-shaped surface features.
As shown in Figure 7b, corresponding
CPFE simulations using a constitutive
model similar to that used in the
previous section (but with latent hardening
included) predicted pile-up patterns
in good agreement with the experimental
measurements. The CRSS
values for prismatic, basal, and pyramidal
slip of the CPFE model were
identified by optimizing the simulation
results (loaddisplacement and residual
pile-up pattern) of the indentation
process in different grain orientations.
Non-linear optimization was conducted
by applying a custom implementation
of the downhill simplex method
after Nelder and Mead.22,23 The calculated
values of CRSS were (150 ± 4)
MPa for prismatic slip, (349 ± 10) MPa
for basal slip, and (1107 ± 39) MPa for
pyramidal slip, respectively.
The CRSS value for prismatic slip is
expected to have better accuracy using
this optimization process than the lesser
active slip systems. These values imply
that basal and slip are more
difficult to activate than the values used
in the prior model, where the ratios
used were 1:2:3 for prism:basal:
CRSS values. However, increasing
these ratios resulted in negligible basal
and slip, which is inconsistent
with the experimental observations.
Introduction of latent hardening using
the 1:2:3 CRSS ratio made only minor
differences, indicating that this highly
tuned phenomenological model based
upon indentation did not significantly
improve the simulation. Two possible
reasons for the poorer fidelity with
experiment are that the loading conditions
for indentation contain significant
hydrostatic compression, which may
affect slip resistance by non-Schmid
stress components that affect slip activation.24 Secondly, the lack of grain
boundaries may also frustrate dislocation
nucleation processes for nonprism
slip.25 Furthermore, the CPFE
simulation does not contain any form
of additional slip resistance across a
grain boundary.13 Simulation of the
sub-surface grain geometry with an
accurate 3D mesh may also positively
affect model accuracy. Improvement
in modeling slip behavior near grain
boundaries appears to be necessary to
improve the agreement between experiment
and simulation.
Slip transfer across
grain boundaries
To better assess how local dislocation
content and orientation gradients
are affected by grain boundaries, slip
transfer phenomena were investigated
in this specimen.26,27 Evidence for slip
transfer is apparent in the boundary between
grains 1 and 2, where the twin in
grain 2 developed due to slip transfer
from the active prism slip system in grain 1. In this case, the geometrical
alignment between the prism slip system
in grain 1 and the twinning system
in grain 2 was quite high. This alignment
is described by the slip transfer
parameter m' = cos ψ · cos κ= 0.94,
where ψ is the angle between the
prism slip plane normal in grain 1 and
the twinning plane normal in grain 2
and similarly, κ is the angle between
the prism slip Burgers vector and the
twinning Burgers vector. In contrast,
slip transfer from the twin system in
grain 2 to the active prism slip system
in grain 3 has m' = 0.73, a significantly
lower value. A statistical comparison
of 26 boundaries with similar geometrical
relationships for active prism
slip in one grain and high Schmid factors
for twinning (under uniaxial tension)
in the neighboring grain showed
that only boundaries with m' values >
0.88 exhibited slip transfer. Because
two boundaries with m' > 0.95 did not
show slip transfer stimulated twinning,
this parameter is apparently necessary
but not sufficient, indicating that local
stress tensors must be considered,
or additional criteria must be satisfied.
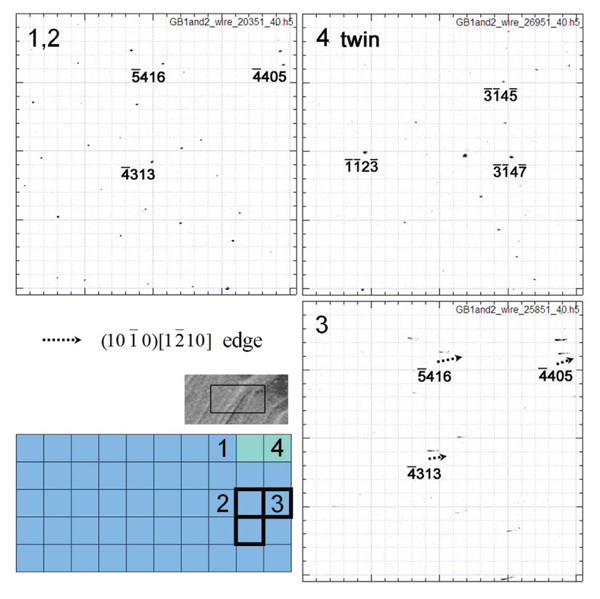
An important outcome of this analysis
Figure 9. A section of the DAXM volume scan near the boundary
between grains 1 and 2 at 2 mm beneath the surface. Grain 1 and
the twin are represented by cyan and turquoise color, respectively.
The 3 pixels surrounded by thick boxes show moderately streaked
peaks, while the other 47 pixels all show sharp peaks. Laue patterns
of 4 pixels are shown. In pattern 3, the black dotted arrows near three
indexed peaks represent the theoretical peak streak direction caused
by ( )[ ]
_ _
1010 1210 edge dislocations.
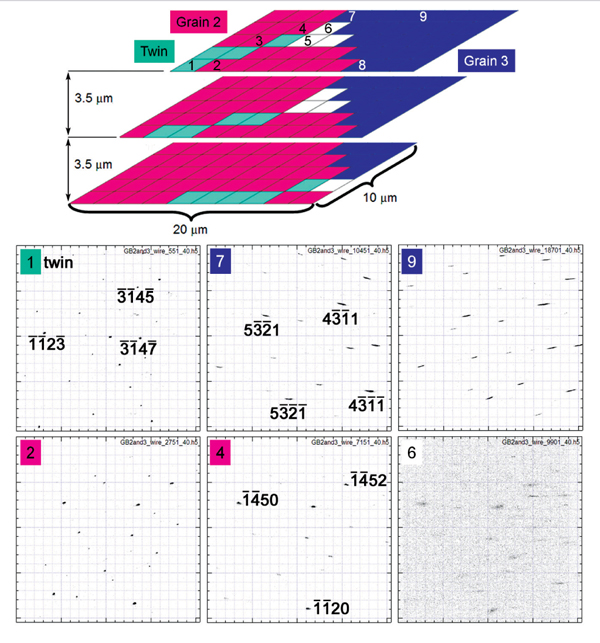
Figure 10. Three sections of the DAXM area scan near the boundary
between grains 2 and 3 show how the grain boundary and twin are
inclined to the surface. Selected Laue patterns from numbered
voxels on the top scan are shown. Laue patterns from grain 3 display
significantly streaked peaks. Pattern 6 uses an intensity threshold
that is lower than the rest of the patterns to make the peaks more
visible.
was that the activated twin system only
sometimes had the highest Schmid
factor (and in a couple of cases the
activated twin system had the lowest
Schmid factor based upon the global
stress state), indicating that nucleation
is the critical part of the process for
activating mechanical twins (see also
Reference 28 for a similar outcome
based upon a statistical study, and Reference
29 that shows how dislocations
entering a grain boundary can facilitate
twin nucleation). These two boundaries
were further investigated using 3D
differential aperture x-ray microscopy
(DAXM3032) to characterize subsurface
microstructure and GNDs at two
ends of a twin in grain 2 to gain further
understanding of slip transfer and
the twin nucleation process. Quantified
GND content is useful for making detailed
comparisons between measured
and simulated GND content.
Characterizing
subsurface
micro-structure
and GNDs
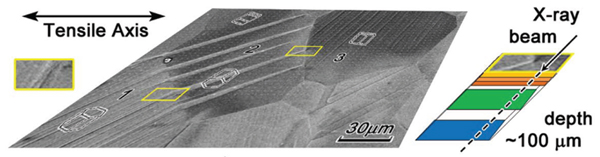
In DAXM, the polychromatic xray
beam penetrated the sample 45°
from the surface normal in the direction
of the tensile axis as illustrated
in Figure 8. Scattered photons from
a polychromatic beam were captured
with an area detector located 90° from
the incoming beam above the sample.
Scans were made where slip transfer
led to twin nucleation, and on the other
side of grain 2 where the same twin
was stopped by the boundary between
grains 2 and 3. Both scans covered a
rectangular surface area of (20 x 10)
mm2, with a step size of 2 mm and the
volume in a subsurface parallelepiped
about 100 mm deep, which can be visualized
as a series of orientation maps
beneath the surface.
In Figure 8, the parallelepiped volume
of the area scan at the boundary
between grains 1 and 2 almost entirely
fell into grain 1. Only a few voxels near
the upper-right corner of the scanned
area show diffraction peaks from the
twin. Figure 9 shows a 2D orientation
map from about 2 mm beneath the surface.
Of the 50 Laue diffraction patterns,
all except the upper right two
patterns came from grain 1. The Laue
patterns of 4 pixels are shown in Figure
9; patterns 1 through 3 are from
grain 1, and pattern 4 from the twin.
All of the diffraction patterns showed
nearly circular (sharp) peaks except for
the three locations marked with a box
where moderately streaked diffraction
patterns were observed. These correspond
to regions where the prism slip
band was not lined up with a location
where slip to twin deformation transfer
occurred at the boundary with grain 2
(note inset in Figure 8). These streaked
spots are evidence for dislocation pileups
that cause an accumulation of
geometrically necessary dislocations.
Using Nye's dislocation tensor, the
theoretical peak streak direction can be
calculated for any chosen GND population
of edge dislocations13,3033 and
compared with experimental measurements.
From such inverse calculations,
the peak streak analysis indicates that
the GNDs could be caused by prismatic
{10 10}<1210> edge dislocations,
which is the system responsible
for the slip bands in grain 1 (it has a
global Schmid factor of 0.478).
The second investigated parallelepiped
with Laue patterns from selected
voxels of grain 2 (red), grain 3 (blue),
and the twin (cyan) are shown in Figure
10. Pattern 1 shows a characteristic
diffraction pattern for the twin with
slightly elliptical peaks, consistent with
the other end of the twin at the boundary
between grains 1 and 2, indicating
a weak presence of GNDs. The three
white voxels ahead of the tip of the twin
have Laue patterns with weak, hazy
peaks, indicating a severely deformed
lattice, but the few recognizable peaks
have the same orientations as grain
2. The extreme deformation is probably
due to the plastic accommodation
where the twin growth interface terminates
in the matrix.3436 In addition,
there is a large shift in peak positions
from voxel 2 to voxel 6, which implies
the existence of a large orientation gradient
in front of the twin tip. In grain
3, the peaks are significantly streaked,
and the direction of streaked peaks in
patterns 7 and 8 is different from that
in pattern 9. Hence, grain 3 has a significant
amount of GNDs, and there
are at least two types of GNDs present.
In the interior of grain 3, at location
9, edge GNDs on the activated prism
< a> slip system {10 10} < 1210> exist
(which has a high global Schmid factor
= 0.467). Near the grain boundary,
a different slip system must account
for the streaked peaks. The strongly
streaked patterns indicate a high GND
population, that is significant pile-ups
of dislocations.
Grains 1 and 3 both displayed active
prismatic slip that impacted boundaries
with grain 2. However, the density of
GNDs in grain 3 was found to be much
higher than in grain 1 by comparing the
extent of the streak in these two grains.
This difference can be accounted for by
the slip transfer effect. Near the boundary
between grains 1 and 2, prismatic
dislocations generated in grain 1 by
slip transfer were readily absorbed and
transformed into twinning dislocations
in grain 2 (m' is 0.94 for this process).
This suggests that no significant dislocation
pile-up remained in grain 1,
resulting in sharp diffraction peaks.
The prismatic dislocations generated in
grain 3, however, which preceded the
twin formation (as the strain caused a
greater depression in grain 3 than grain
1 in Figure 5a), were less able to transfer
into grain 2, as m' between the twin and
the prismatic slip in grain 3 was 0.73,
much lower than the average m' value
in grain pairs where sliptwin transfer
occurred. As slip transfer was not possible,
prismatic dislocations piled up at
the boundary between grains 3 and 2
and caused lattice curvature (streaked
peaks), and activation of at least one
other accommodating slip system. The
smaller m' can account for the fact that
the twin terminated in grain 2 instead
of further expanding along the boundary
between grains 2 and 3.
Finally, the DAXM technique can
be coupled with CPFE modeling, to
p provide a non-destructive assessment
of grain boundary inclinations.
The DAXM scan at the boundary between
grains 2 and 3 shown in Figure
10 shows that it is almost perpendicular
to the sample surface. It is possible
to compare lattice rotation (peak
shift and streaked peaks) measured by
DAXM with the calculated rotations
from CPFE simulations, which will be
examined in future work. From these
studies, criteria that describe how dislocations
interact with grain boundaries
can be developed, which should be
implemented into constitutive models
used in CPFE simulation.
CONCLUSIONS
The experimental results indicate
that a CPFE model with phenomenological
hardening can simulate the
heterogeneous deformation process in
commercial purity titanium at a level
that is roughly consistent with experiments.
The spatial distribution of deformation,
however, shows some differences
from the experimental measurement.
Optimized simulation of the
nano-indentation process constrained
by experimental measurements led to
refined constitutive parameters, but use
of these parameters did not significantly
improve the simulation. The nanoindentation
approach evaluated slip
behavior in hydrostatic compression
states that may not be equivalent to the
predominantly tensile stresses present
in the bent polycrystalline sample. To
further improve the accuracy of CPFE
simulation, a deeper understanding of
how deformation is influenced at and
across grain boundaries needs to be cast
into the constitutive description of crystal
plasticity.
ACKNOWLEDGEMENT
This research is supported by a
Materials World Network grant (NSF
DMR-0710570 and DFG EI 681/2-1).
Use of the Advanced Photon Source
was supported by the U.S. Department
of Energy, Office of Science, Office of
Basic Energy Sciences, under Contract
No. DE-AC02-06CH11357. R.B. is supported
by the Materials Sciences and
Engineering Division, Office of Basic
Energy Sciences, U.S. Department of
Energy.
REFERENCES
1. R.A. Lebensohn and C.N. Tome, Acta Metall. Mater.,
41 (9) (1993), pp. 26112624.
2. Z. Yao and R.H. Wagoner, Acta Metall. Mater., 41 (2)
(1993), pp. 451468.
3. F. Delaire, J.L. Raphanel, and C. Rey, Acta Mater., 48
(5) (2000), pp. 10751087.
4. S. Zaefferer, Mater. Sci. Eng. A, 344 (2000), pp.
2030.
5. F. Bridier, P. Villechaise, and J. Mendez, Acta Mater.,
53 (2005), pp. 555567.
6. J.W. Christian and S. Mahajan, Prog. Mater. Sci., 39
(1995), pp. 1157.
7. F.P.E. Dunne, D. Rugg, and A. Walker, Int. J. Plasticity,
23 (2007), pp. 10611083.
8. R. Becker and S. Panchanadeeswaran, Acta Metall.
Mater., 43 (1995), pp. 27012719.
9. D. Raabe, M. Sachtleber, Z. Zhao, F. Roters, and S.
Zaefferer, Acta Mater., 49 (2001), pp. 34333441.
10. S.R. Kalidindi, A. Bhattacharyya, and R.D. Doherty, Proc. R. Soc. Lond., 460A (2004), pp. 19351956.
11. F. Roters, Comput. Mater. Sci., 32 (2005), p. 509.
12. F. Roters, P. Eisenlohr, L. Hantcherli, D.D. Tjahjanto,
T.R. Bieler, and D. Raabe, Acta Mater., 58 (2010), p.
1152.
13. L. Wang, R. Barabash, Y. Yang, T.R. Bieler, M.A.
Crimp, P. Eisenlohr, W.J. Liu, and G.E. Ice, Metall.
Mater. Trans. A, 42A (2011), pp. 626635.
14. Y. Yang, L. Wang, T.R. Bieler, P. Eisenlohr, and M.A.
Crimp, Met. Mat. Trans., 42A (2011), pp. 636644.
15. B. Wagenknecht, D. Libiran, S. Poon, and K.
Sztykiel, "In-Situ Four-Point Bending Apparatus for
Scanning Electron Micro- scopes" (Senior Design
Project, Mechanical Engineering, Michigan State
University, Apr. 2008).
16. S.R. Kalidindi, C.A. Bronkhorst, and L. Anand, J.
Mech. Phys. Solids, 40 (1992), pp. 537569.
17. S.R. Kalidindi and L. Anand, Metall. Trans. A, 24A
(1993), pp. 989992.
18. A.A. Salem, S.R. Kalidindi, and S.L. Semiatin, Acta
Materialia, 53 (2005), pp. 34953502.
19. C. Zambaldi and D. Raabe, Acta Mater., 58 (2010),
p. 3516.
20. C. Zambaldi, Y. Yang. T.R. Bieler, and D. Raabe, J.
Mater. Res., (accepted for 2012 publication).
21. B.A. Simkin, B.C. Ng, T.R. Bieler, M.A. Crimp, and
D.E. Mason, Intermetallics, 11 (2003), pp. 215223.
22. J. Nelder and R. Mead, Computer Journal, 7 (1965),
p. 308.
23. W. Press, S. Teukolsky, W. Vetterling, and B.
Flannery, Numerical Recipes C++ (Cambridge, U.K.:
Cambridge University Press, 2007).
24. V. Vitek, A. Mrovec, R. Groger, J.L. Bassani, V.
Racherla, and L. Yin, Mater. Sci. and Eng., A-387
(2004), pp. 138142.
25. M.A. Tschopp, D.E. Spearot, and D.L. McDowell,
Dislocations in Solids, Vol. 14, ed. J.P. Hirth (Cambridge,
MA: Elsevier Publishers, 2008), pp. 43140.
26. L. Wang, Y. Yang, P. Eisenlohr, T.R. Bieler, M.A.
Crimp, and D.E. Mason, Metall. Mater. Trans. A, 41
(2010), pp. 421430.
27. L. Wang, P. Eisenlohr, Y. Yang, T.R. Bieler, and M.A.
Crimp, Scripta Materialia, 63 (2010), pp. 827830.
28. I.J. Beyerlein, L. Capolungo, P.E. Marshall, R.J.
McCabe, and C.N. Tome, Philosophical Magazine, 90
(2010), pp. 21612190.
29. J. Wang, R.G. Hoagland, J.P. Hirth, L. Capolungo,
I.J. Beyerlein, and C.N. Tomé, Scripta Materialia, 61
(2009b), pp. 903906.
30. R. Barabash, G. Ice, B. Larson, G.M. Pharr, K.-S.
Chung, and W. Yang, Appl. Phys. Letters, 79 (2001), pp.
749751.
31. W. Liu, G.E. Ice, B.C. Larsen, W. Yang, and J.Z.
Tischler, Ultramicroscopy, 103 (2005), pp. 199204.
32. R.I. Barabash, G.E. Ice, M. Kumar, J. Ilavsky, and J.
Belak, Int. J. Plast., 25 (2009), pp. 20812093.
33. L. Wang, "Evolution of Deformation Twins and
Dislocation Near Grain Boundaries in Commercial
Purity Titanium" (Ph.D. Dissertation, Michigan State
University, 2011).
34. A.W. Sleeswyk, Acta Metallurgica, 10 (1962), pp.
705725.
35. S. Mahajan and G.Y. Chin, Acta Metallurgica, 22
(1974), pp. 11131119.
36. S. Vaidya and S. Mahajan, Acta Metallurgica, 28
(1980), pp. 11231131.
Y. Yang, L. Wang, M.A. Crimp, and T.R. Bieler are
with the Department of Chemical Engineering and
Materials Science, Michigan State University, East
Lansing, MI 48824; P. Eisenlohr and C. Zambaldi are
with the Max-Planck-Institut für Eisenforschung,
Düsseldorf, Germany; R.I. Barabash is with Oak
Ridge National Laboratory, Oak Ridge, TN; W. Liu is
with Advanced Photon Source at Argonne National
Laboratory, Argonne, IL; M.R. Stoudt is with the National
Institute of Standards, Gaithersburg, MD. Prof.
Bieler can be reached at bieler@egr.msu.edu.
|
 Presenting a Web-Enhanced