 Presenting a Web-Enhanced Presenting a Web-Enhanced Article from JOM |
 LATEST ISSUE |
|||
TMS QUICK LINKS: |
• TECHNICAL QUESTIONS • NEWS ROOM • ABOUT TMS • SITE MAP • CONTACT US |
JOM QUICK LINKS: |
• COVER GALLERY • CLASSIFIED ADS • SUBJECT INDEXES • AUTHORS KIT • ADVERTISE |
|
| Materials for Crashworthiness and Defense: Feature | Vol. 62, No.1 pp. 24-30 |
the National Ignition Facility
M.A. Meyers, B.A. Remington, B. Maddox, and E.M. Bringa
Questions? Contact jom@tms.org. |

|
In recent years a powerful experimental tool has been added to the arsenal at the disposal of the materials scientist investigating materials response at extreme regimes of strain rates, temperatures, and pressures: laser compression. This technique has been applied successfully to mono-, poly-, and nanocrystalline metals and the results have been compared with predictions from analytical models and molecular dynamics simulations. Special flash x-ray radiography and flash x-ray diffraction, combined with laser shock propagation, are yielding the strength of metals at strain rates on the order of 107108 s1 and resolving details of the kinetics of phase transitions. A puzzling result is that experiments, analysis, and simulations predict dislocation densities that are off by orders of magnitude. Other surprises undoubtedly await us as we explore even higher pressure/ strain rate/temperature regimes enabled by the National Ignition Facility. INTRODUCTION Ever since the discovery of lasers in the 1950s their interactions with materials have been explored. Laser welding, cutting, surface treatment, and heat treatment of metals are well established technologies which are highly successful. By far the most important application of lasers is in optical storage devices. The power of lasers ranges from less than 1 mW (for a common laser pointer) to 700 TWthe combined energy of 192 laser beams focused on a minute 23 mm diameter target at the National Ignition Facility at Lawrence Livermore National Laboratory (LLNL) in Livermore, California.1 It was realized early that lasers can also produce shock waves in materials. As early as 1963, Askaryon and Morez2 demonstrated that shock pulses could be generated in metals from laser-pulseinduced vaporization at the surface. The use of surfaces covered by a lasertransparent
overlay was introduced by
Anderholm;3 this enabled the confinement
of the vapor products, resulting in
an increase of the peak pressure of the
shock launched into the metal. Shock
amplitudes as high or higher than
those generated by explosives or planar
impact devices could be generated with
a fundamental difference: the duration of the shock pulse was in the nanosecond
range. In the 1980s Clauer et al.4 used these laser-induced shock pulses
to modify the structure of engineering
alloys, increasing their strength and fatigue
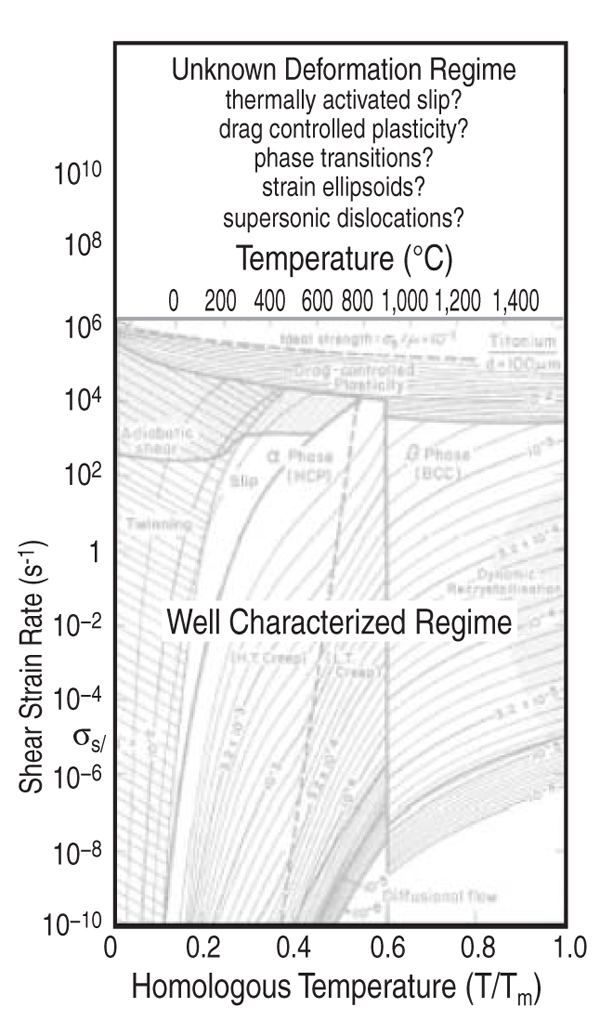
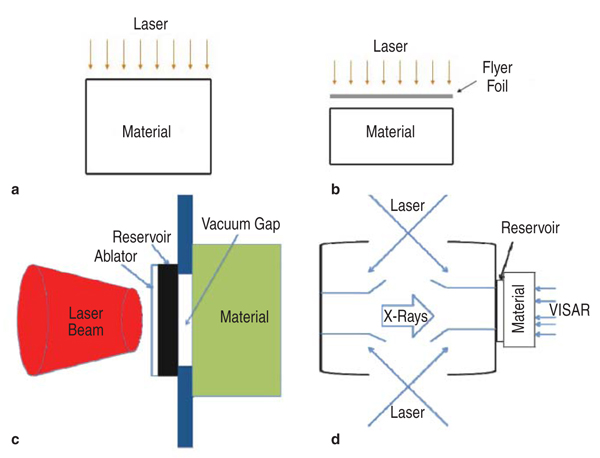
resistance. The extreme regimes of pressure, temperature, and strain rates that comprise the top portion of the plot can only be accessed through very special methods. Although the fi rst fundamental investigation, by C.S. Smith,6 was carried out approximately 60 years ago, this remains a frontier area. For strain rates from 106 to 1010 s1, deformation mechanisms are less well understood and conventional deformation mechanisms are not applicable. An additional complexity is introduced by nanostructured metals, in which the mechanisms of plastic deformation are significantly different. Compression by high-power lasers is one of the methods through which we can access these extreme regimes. LASER-MATERIAL INTERACTION Laser-induced shock waves can be launched by several techniques; Figure 2 shows two more traditional and two novel methods to illustrate the experimental choices. Figure 2a shows the direct incidence of laser energy on the surface of the metal. The energy deposited onto the metal surface causes it to vaporize. The vapor pressure creates a pressure pulse into the metal specimen. Alternatively, lasers can be used to accelerate a foil onto the target, generating a shock wave of square shape in this manner (Figure 2b). The difference in the duration of the pulse between lasers and gas gun or explosively driven flyer plates is on the order of 100 or more. To access very high pressure regimes of material deformation and lattice dynamics, it is desirable to increase the pressure to as high a level as possible without melting the target. A slower compression rate, called quasi-isentropic compression, presents a definite advantage over the sharp shock compression, with a strain rate at the front that is orders of magnitude lower. This quasi-isentropic
compression can be accomplished by
using a reservoir, shown in Figure 2c.
This acts as a pillow that softens the
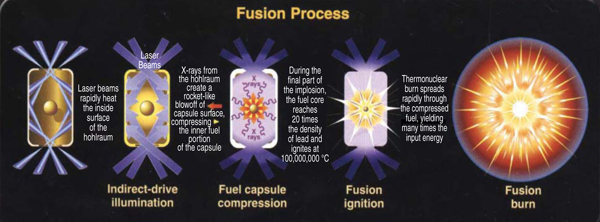
blow of the laser.79 A fourth method uses the Hohlraum effect (Figure 2d).
This is a German word that means
hollow cavity. It is the principle of
energy deposition of the National Ignition
Facility and will be described in a
later section. In essence, it enables the
generation of x-rays which illuminate
the target in a more uniform manner.
The lasers converge into the Hohlraum
and deposit their energy on the internal
walls, heating them up until they glow
in the soft x-ray spectral regime, creating
a mini-radiation chamber which
then launches a shock into the sample
being studied. These x-rays are the primary
source of energy deposition onto
the specimens.
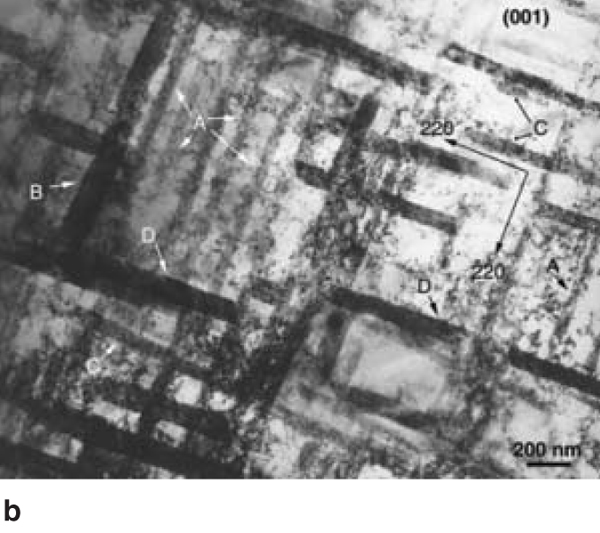
This rapid decay of the pulse presents an advantage in freezing in the structural changes introduced by the pulse, since it acts as a self-quenching mechanism. In gas gun and explosive experiments the postshock temperature of the samples can rise easily to levels where recovery and recrystallization occur, destroying the effects that we want to study. The lateral dimensions of the laser beam are small in comparison with gas gun and explosive experimentsa few mm versus 100300 mm. However, these dimensions are sufficient to extract specimens for characterization by transmission electron microscopy.
Lasers and molecular dynamics simulations
are well suited for each other,
since they both occur at high strain
rates (~108 s1). This is even more accentuated
if nanocrystalline metals are investigated because the size of
grains that can be modeled in molecular
dynamics is in the nanometer range.
Thus, the comparison of structures
characterized by transmission electron
microscopy (TEM) from laser recovery
experiments with molecular dynamics
(MD) simulations is a fertile ground for
research.
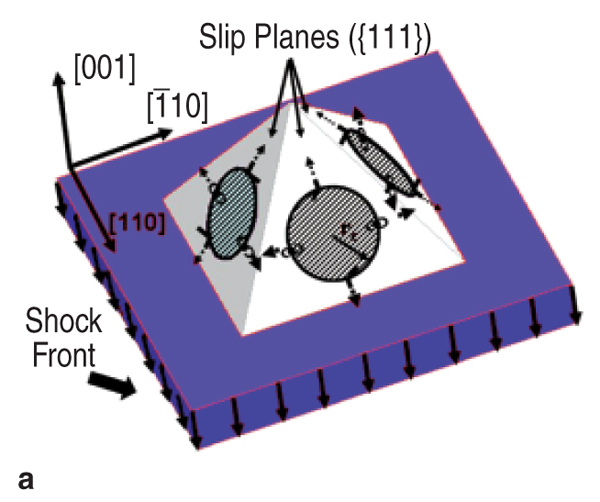
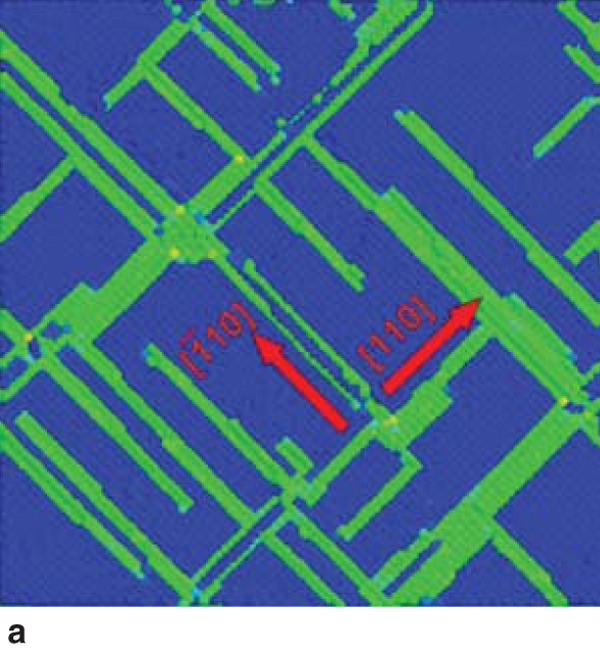
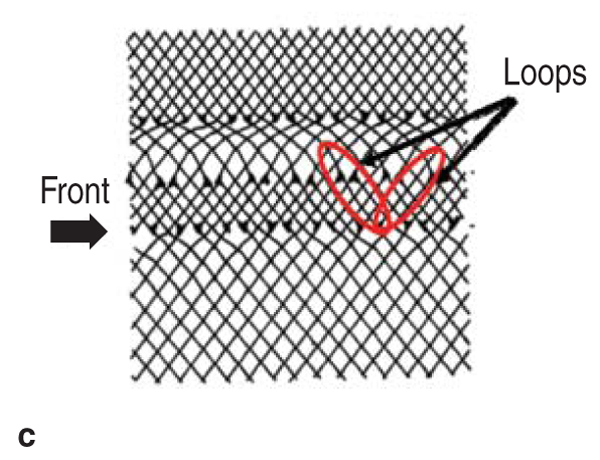
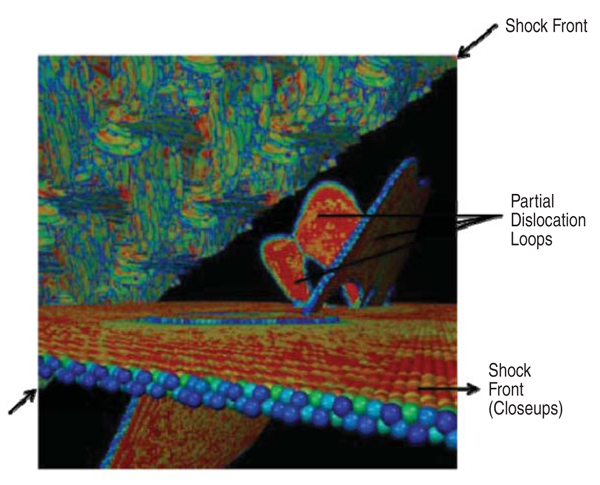
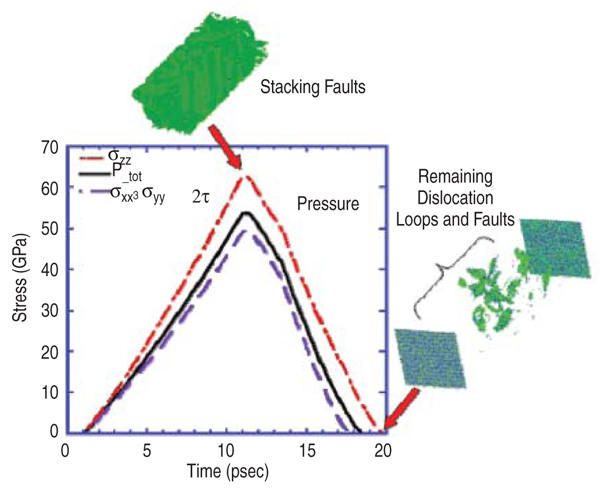
The formation of these
defects can be modeled by molecular
dynamics, and the results are shown
in Figure 5.10 A section through the
simulation box in Figure 5a shows the parallel lines which are stacking faults.
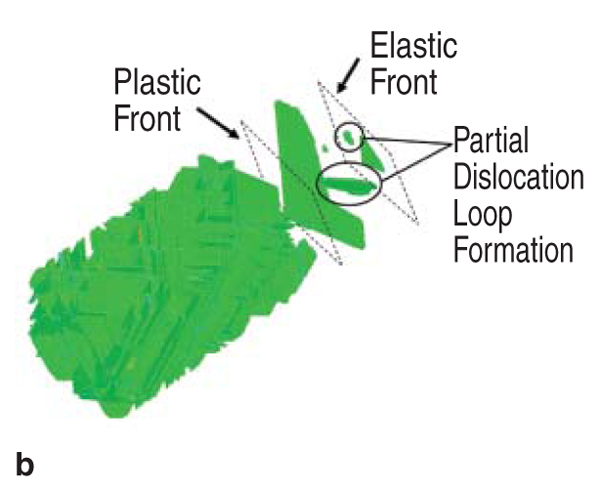
The formation of these stacking faults
through the generation and expansion
of partial dislocation loops is shown in
Figure 5b. The density of these loops
increases behind the shock front. The
formation of these loops is complex,
with schematic pictures already advanced
early on, as shown in Figure
5c.11 We note that the leading edge of
partial loops can develop velocities
close to the bulk sound velocity, at this
high stress and when not pulled back
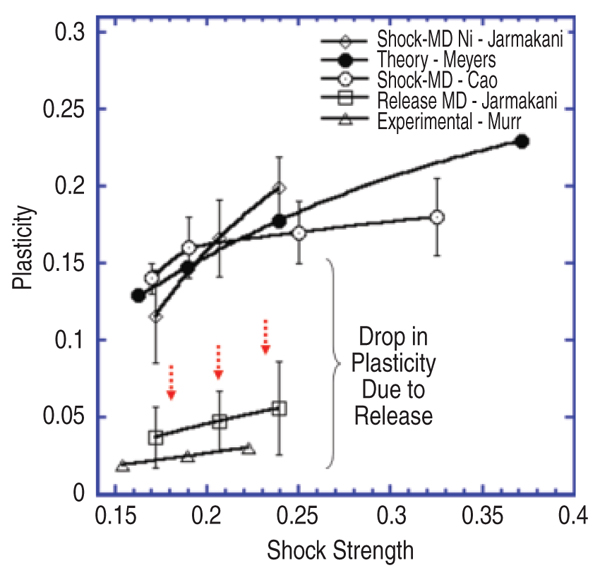
by a trailing partial dislocation. Although results by Murr15 are shown, extensive TEM work by other groups confirm these low (in comparison with MD and theoretical predictions) dislocation densities (expressed as plasticity in Figure 7; see caption for relationship between the two) (e.g., Bourne et al.16). Murr and KuhlmannWilsdorf17 had predicted an empirical relationship of the form between the pressure, P, and dislocation density, π, based on experimental measurements of dislocation cell sizes: π α P1/2. Figure 7 shows that the experimental results, in the bottom of the plot, follow the same trend as the MD simulations and theory, but are lower by orders of magnitude. This difference is not yet completely understood, but three effects play a role, separately or jointly:18
This and many other issues are not yet resolved, and laser experiments combined with molecular dynamics simulations and physically based models will shed light on the deformation mechanisms in these extreme regimes. Of particular importance are flash x-ray diffraction experiments which can probe the shocked state and infer the defect structure during the laser compression process. These experiments are currently being carried out by Wark and coworkers at Oxford University, U.K.,19,20 using the Vulcan Laser facility, and by Hawreliak et al.,21 and Milathianaki and McNaney et al.22 at LLNL using the Omega and Janus facility. Another new technique is to use flash x-ray radiography to observe the rate of material deformation driven by buoyancy-type hydrodynamic instabilities. This new experimental technique allows material strength to be inferred at very high pressures and strain rates.23,24 This technique will be developed on the NIF laser, where samples in the solid state can be studied at extraordinary pressures, P > 103 GPa, approaching those found, for example, at the centers of the giant planets.7,25 The experimental facilities of Omega (Laboratory for Laser Energetics, University of Rochester, New York), Jupiter (LLNL), Trident (Los Alamos National Laboratory), and Vulcan (U.K.) enable unique materials experiments. These facilities have been and are being successfully used to explore the extreme material regimes not accessible by other shock wave means such as explosive detonation and gas gun impact. The National Ignition Facility at LLNL will provide a much higher energy deposition capability. As we embark on the NIF era, it is imperative to understand the basic physics of plastic deformation of advanced materials in the extreme regimes created under these conditions. The National Ignition Facility Program at LLNL is designed to provide:
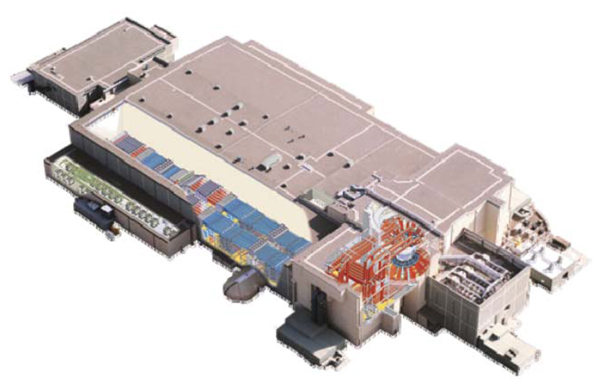
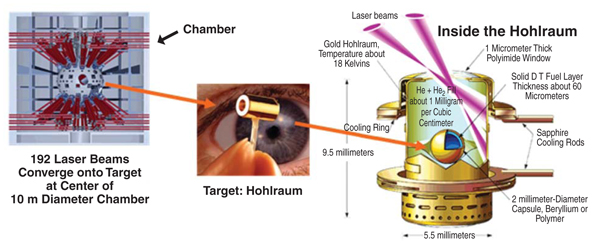
The National Ignition Facility is massive, with 192 high-power laser beams designed to be fired simultaneously and focused on a capsule. Figure 9 shows an overall view of the facility, which occupies an area equivalent to approximately four football fields. These 192 laser beams converge onto a chamber having approximate diameter of 10m (Figure 10). Precise timing of the beams has to be ensured to within ~50 ps. These beams enter a hollow cylinder, the Hohlraum, interact with the walls and generate the intense xrays that illuminate the capsule (Figure 11). Direct incidence of the laser beams onto the hollow capsule is less uniform and can create instabilities in the compression process. The capsule, which contains the fusion material (a solid deuterium layer with 80 μm thickness), is compressed from its initial diameter of 2 mm to approximately 0.5 mm. At that point fusion burn should take place, generating more energy than the combined energy of the laser beams. Laser-induced shocks and isentropic compression are new and powerful research tools to investigate the behavior of materials under extreme conditions. The processes of plastic deformation, fracture, and fragmentation under these conditions are still poorly known. Many questions remain to be explored using the powerful experimental capabilities, instrumentation and diagnostic tools, computational and analytical techniques, and advanced characterization methods.
1. C.A. Haynam et al., Appl. Optics, 46 (2007), p. 3276. M.A. Meyers is at the University of California, San Diego; B.A. Remington and B. Maddox are with Lawrence Livermore National Lab.; and E.M. Bringa is with the Universidad Nacional de Cuyo, Argentina. Dr. Meyers can be reached at mameyers@ucsd.edu.
|