Mathematical modeling is an important
tool for the development of materials
and processes for making them. Modeling
electrochemical processes for smelting
or plating metals presents several
particularly difficult challenges. Boundary
conditions are nonlinear and timedependent,
often because phenomena at
multiple length scales are inextricably
linked. For example, the Angstrom-scale
double layer gives rise to nonlinear voltage-current behavior, which is a boundary
condition for macroscopic models.
And development of micrometer-scale
dendrites dramatically changes both the
product form and the apparent resistance
at the interface; chemical additives can
suppress dendrites and produce superconformal
filling of very rough surfaces.
This paper gives an overview of modeling
approaches at all length scales from
Angstroms to meters, including both mean
field and atomistic approaches.
INTRODUCTION
Electrometallurgy dominates aluminum
extraction, is significant in magnesium
production, and has wide applications
in the refi ning of copper and many
other metals. In many metallothermic
reduction processes, electron transfer
provides a pathway for reduction and
oxidation reactions to happen at different
locations, providing more reaction area
and improving kinetics. On a much smaller scale, integrated circuit copper
metallization uses electroplating, not
evaporation or chemical vapor deposition,
because of its superconformal filling
ability. All of these processes share the
use of electrons to change the oxidation
state of ions and atoms.
Engineers designing these processes
face a wide variety of challenges. At the
largest scales, uneven current distribution
leads to uneven plating rate or uneven
heating of cell components. At smaller
scales, the deposit often forms dendrites,
which are usually a poor product and can
even stretch across the electrolyte and
create a short circuit. In the Hall cell,
aluminum forms streamers which are the
liquid equivalent of dendrites; these break
into tiny droplets or metal fog that
increase the electronic conductivity of
the electrolyte, reducing cell efficiency.
Electrochemistry also creates significant opportunities. Additives can eliminate
dendrites and help to fill rough
surfaces and deep trenches more uniformly
than with other thin film techniques.
Alternating current with a carefully
chosen waveform can create a
powder or flake product. And on a small
scale a carefully controlled short circuit
can be used as a switch.
As with any engineering pursuit,
mathematical models can facilitate the
design of electrochemical cells around
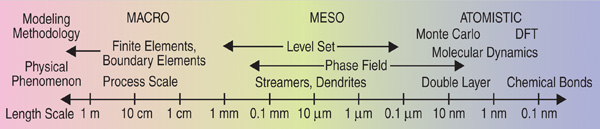
these challenges and opportunities. Such
models fall into three categories based
roughly on length scale (Figure 1). Macroscopic
models predict current densities
and plating rates over centimeter to meter
lengths. Meso-scale models predict
interface stability and the shape of dendrites
or streamers at submicrometer to
millimeter scales; some also resolve
nanometer-scale double layer phenomena
and estimate non-ohmic charge transfer
resistance. And finally, atomistic models
explicitly track the motion of individual
atoms, sometimes even their bonding
electrons, to study fundamental mechanisms
of bonding and charge transfer at
interfaces.
The following sections that describe
these models and their applications will
focus on processes for making metals,
leaving aside topics such as batteries and
corrosion.
MACROSCOPIC MODELS
The purpose of macroscopic models
is to help engineers lay out electrochemical
cells on centimeter or larger
scales in order to achieve a desired plating
rate profile. They calculate the electrical
potential, concentration, and
sometimes electrolyte flow velocity
fields, which determine the ionic current
from anode to cathode. The current is
driven by the applied voltage and limited
by resistance to ionic conduction throughout
the electrolyte, resistance due to slow
mass transfer (if applicable), and nonohmic
(nonlinear) resistance to electrochemical
reaction kinetics at the cathode
and anode surfaces. Generally the macroscopic
models assume smooth electrode
surfaces, ignoring any roughening
due to uneven plating.
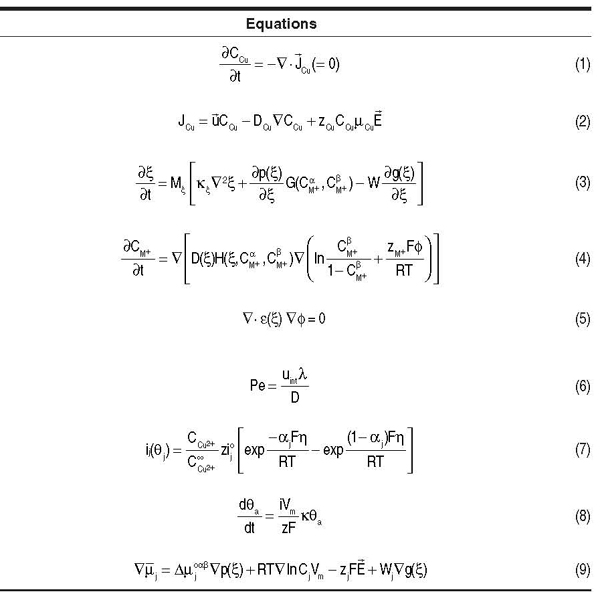
The Nernst–Planck equations1 describe
transport of ions in the electrolyte (e.g.,
of Cu2+ ions in aqueous solution for
copper plating). Equation 1 shows the
rate of change of local copper concentration
CCu due to its flux.
Many electrochemical cells rapidly
establish a steady state where the local
concentration changes very slowly, thus
∂CCu/∂t = 0. In the most general case,
the flux has terms for diffusion with
diffusivity DCu, convection fluid flow due
to velocity field ū, and electromigration
due to electric field Ē
as shown in Equation 2, where zCu is the ionic charge (two
for Cu2+) and μCu is mobility given by
the Einstein relation DCu = (RT/F )μCu.
R is the gas constant, T is the absolute
temperature, and F is Faradays constant.
Put in words, flux follows the flow, goes
down the concentration gradient (from
high to low concentration), and (positive)
cations follow the electric field while
anions go the opposite way. In many plating and smelting operations, electromigration
is much faster than diffusion
and flow mixes the electrolyte rapidly,
such that the electromigration term
dominates the flux. Generally, macroscale
simulations solve Equation 2, along
with conservation equations for other
ions and an equation for conservation of
charge, to compute the distributions of
concentrations and electrical potential.
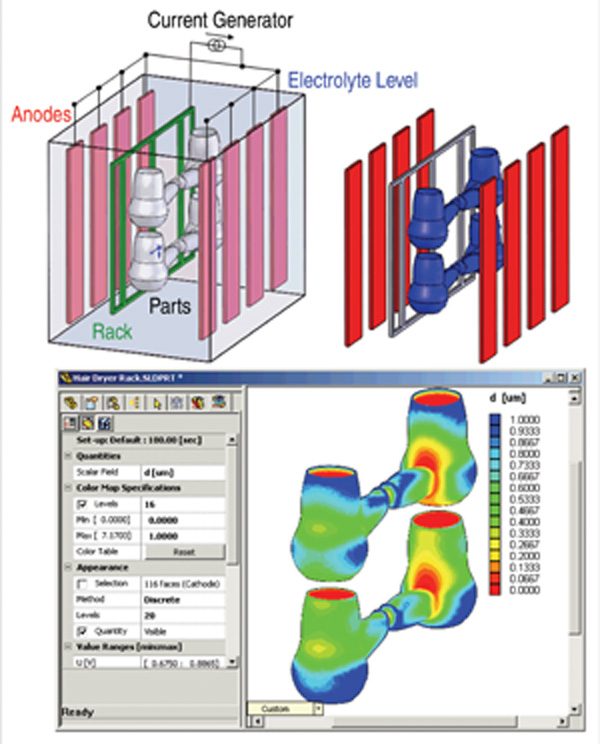
Figure 2 shows the result of a calculation
which estimates the distribution of
plating current driven by the imposed
potential based on electrolyte resistance
(using electromigration flux alone) and
charge transfer resistance at the electrode
surfaces. A process engineer can use this
model to position the electrodes in order
to make the current density relatively
uniform, and to determine at what total
current the highest local plating current
density might lead to a rough deposit.
The paper by U. Pal and A. Powell in
this issue gives another example of this
type of model. In the magnesium oxide
reduction cell described there, the design
objectives are to minimize overall cell
resistance and to avoid high local current
density through the solid oxide membrane
anodes in order to prevent excessive
local heating. Again, the model
provides guidance for electrode placement
that best meets these criteria.
These models are thus very useful
design tools for estimating plating rates
when the deposit is smooth. However,
in many cases, particularly with additives,
it is hard to know a priori when
the deposit will be smooth or rough. And
in some cases, one wants a rough deposit
and needs to know how the process
parameters determine the shape of dendrites
or whether they break off (e.g., for
making powder or flake product). For
these cases, meso-scale models are
necessary.
MESOSCALE MODELS
Models at the micrometer to millimeter
scale simulate shape and topology
dynamics at the deposit surface. Such
models often assume simplified charge
transfer resistance at the interface, such
as first-order (linear, ohmic) kinetics or,
at high temperature, negligible charge
transfer resistance.
Typically, boundary conditions apply
at the phase interface that depend on the
shape and local environment of that interface. These boundary conditions
cause the interface to evolve by deposition
or dissolution, which changes its
shape and local environment, which
again causes it to evolve, forming structures
such as solid dendrites or liquid
streamers. Such complicated morphologies
present significant challenges for
traditional sharp interface methods as
sections of the interface either impinge
or break off. Complex algorithms are
needed to determine whether, and where,
to insert or delete mesh points along the
changing interface.
The class of diffuse interface methods
overcomes this topological difficulty
by not attempting to explicitly track the
position of the interface. Rather, they
introduce a continuously varying field.
Contours on this field with a particular
value (sometimes called level sets) are
taken to represent the position of the
interface. Changes in topology (impingement,
voids, nucleation of new phases)
present no difficulty for these methods
because the changing contour plays no
role in the calculation; it is simply a
visualization tool.
There are two broad classes of diffuse
interface techniques for electrochemical
modeling. Phase field models begin with
fundamental thermodynamic and kinetic
principles and derive governing equations
that may or may not be directly
compared to their empirical counterparts,
but which often predict the rich behavior
observed in experiments. Level set
models start with known empirical relationships
and model the evolution of
complex morphologies.
Transport-Limited Phase Field Models
Y. Shibuta et al.4,5 and A. Powell et al.6–12 developed phase field models for
electrochemical processes with negligible
interface effects on current flow.
These models use Laplaces equation
(Shibuta) or continuity of current density
(Powell) to calculate the electrostatic
potential. The gradient of the potential,
which is the electric field, then drives
the metal ions in the electrolyte phase
and the electronic current in the metal
phase.
At high temperature or in situations
with slowly flowing or stagnant electrolytes,
charge transfer at the interface
is much faster than mass transfer to the interface. Under these mass transfer-limited
conditions, models may assume that
charge transfer resistance at the interface
is negligible. When charge accumulation
at interfaces is faster than other changes
affecting the electric field (e.g., not highfrequency
alternating current), models
may further assume that net charge at
the interface is quasi-steady-state, so
normal charge density is the same on
both sides.
Shibuta4 begins with a Ginzburg–Landau free energy functional that
includes the electrostatic potential. The
phase field order parameter ξ ranges from 1 in the electrode (α) to 0 in the electrolyte (Β). The model assumes that the electrode is an ideal metal M and the electrolyte is an ideal sulfide M2A or MA. This is thus a binary M–A system. For simplicity, the model uses a dilute-solution approximation in the electrode and an ideal-solution approximation in the electrolyte phase. It also assumes that the molar volumes of M and A are the same. Hence, the free-energy density is expressed using CM+, the mole fraction of M, and the phase field parameter ξ. Based on the KKS model13 with the above conditions, the governing equations are Equations 3 and 44 where Mξ is the mobility of the phase field, ρ(ξ) characterizes the energy of gradients in the phase field, ρ(ξ) is an interpolation function, g(ξ) is a double well potential energy function, W is the height of that double well, G(CaM+ ,CΒM+) is the thermodynamic driving force for M+ M+ phase transformation, and H(ξ, CaM+,CΒM+) is a thermodynamic factor relating diffusivity to M+ M+ mobility. The superscript α and Β denote the value of CM+ projected into the bulk electrode or electrolyte phase, respectively.
In addition to Equations 3 and 4,
Laplaces Equation 5 with an applied
voltage at the boundary is solved for the
distribution of the electrostatic potential.
Shibuta et al. use this model to simulate
two processes:
- Bridge formation in a nanometer
scale switch
- Electrochemical deposition of
metals from an unsupported electrolyte
solution
K. Terabe et al.14 and T. Sakamoto et al.15 developed nanometer-scale switches
in ionic/electronic conductor systems such as Cu/CuS and Ag/Ag2S. They
operate by electrochemically depositing
a metal bridge through the sulfide.
However, experiments have shown that
these switches have limited lifetimes,
and the reason for this is still unknown.
A numerical simulation may help with
their development.
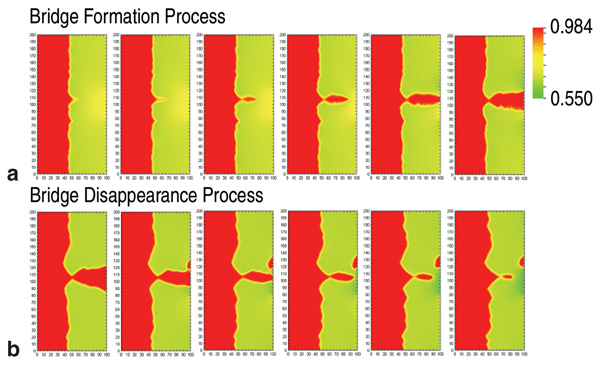
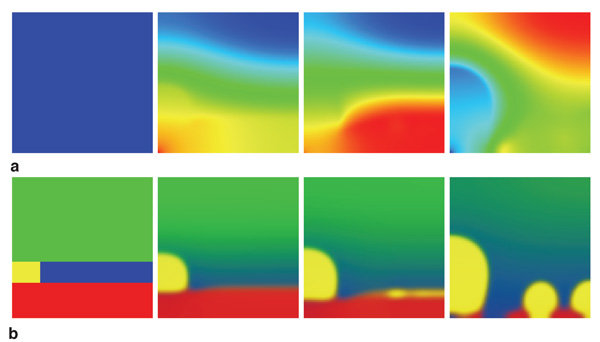
Figure 3a shows snapshots of the
electrolyte concentration during bridge
formation. The voltage signal at the right
boundary amplified the disturbance of the
interface caused by noise. Then, a cusp
made by the disturbance of the interface
rapidly grew by plating toward the right
edge where voltage was largest, and
eventually reached the right boundary.
The narrowest part of the bridge was
against the bulk electrode. Next, the
voltage reversed polarity for 23.5 μs.
Figure 3b shows snapshots of the bridge
disappearance process in response to the
positive applied voltage. The electrode
cusp dissolved from the right side and the
bridge structure was separated. Though
this calculation used parameters for ideal
metal/sulfide M/M2A, it can provide
insight into the bridge formation process
to guide experiments.
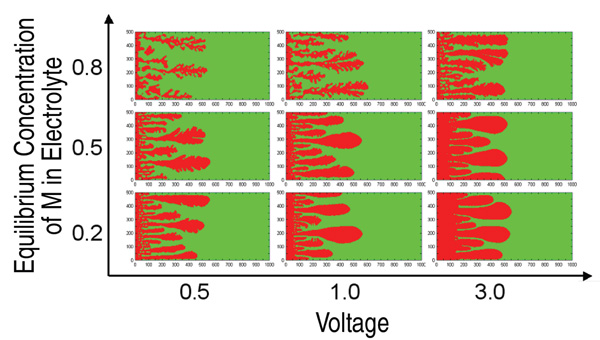
The next application was electrodeposition.5 Plating morphologies come
in many varieties, including homogeneous,
dendritic, fractal, open-ramified,
finger-like, and other complex structures
depending on applied voltage and electrolyte
concentration.16–20 Others have used diffusion-limited aggregation20 and mean-field lattice gas21,22 approaches to study these phenomena. Shibuta et al.5,23 applied a phase field model to analyze
the morphological transition of electrodeposits.
Figure 4 shows deposit morphologies
calculated by this method as a function
of the applied voltage and equilibrium
mole fraction of M+ in the electrolyte. For
a given applied voltage, deposits tended
to be dendritic at higher concentrations.
Growth velocity of the deposits was
proportional to the applied voltage at
each concentration. These parameters
need to be revised23 for real materials such as Cu/CuSO4 or Zn/ZnSO4 in order to make them physically meaningful.
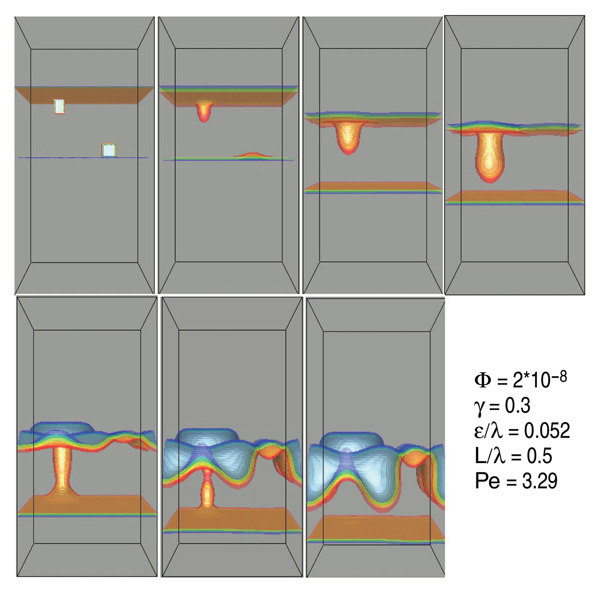
The models of Powell and W. Pongsaksawad
use a very similar methodology
toward several ends. First, they model
migration and breakdown of an FeO
layer in iron under an electric field in
three dimensions, as shown in Figure 5.
The perturbation on the anode shrinks
because dissolution is faster there,
making the anode unconditionally stable,
whereas the perturbation on the cathode
grows because plating is faster there.
Second, they use numerical simulations
to extend traditional linear stability
analysis of electrodeposition. Stability of
a sinusoidal perturbation of wavelength λ is determined by the Péclet number, which is given by Equation 6. This indicates that the surface is more likely to
roughen at wavelength λ if the deposit is growing fast (large uint plating velocity) and ion diffusivity D is small. The linear stability theory by Barkey24 assumes
that electrodes are infinitely far apart
and have perfect conductivity relative to
the electrolyte, and that the interface is
perfectly sharp. Under these conditions,
the interface is unstable when the Péclet
number is above a critical value of 0.116.
This gives the smallest wavelength λ which will grow for a given plating rate uint and diffusivity D.
Pongsaksawad and Powell extend this
theory by calculating the critical Péclet
number of a solid cathode as a function of
interface thickness, electrode/electrolyte
conductivity ratio, and electrode separation/
wavelength ratio. They also model a
fully liquid system, like liquid aluminum
electrolysis in the Hall cell, and show that
at low viscosity, flow provides another
mechanism to stabilize the interface.
Finally, they extend the model to a
ternary system. This model can capture
electronically mediated reactions, such
as metallothermic reduction. The simulation
shown in Figure 6 illustrates the
reaction between titanium dichloride
and magnesium to produce titanium
and magnesium chloride. In this simulation,
electrical potential is low at the Mg-MgCl2 interface where electrons
are produced and high at the Ti-TiCl2 interface where they are consumed.
CEAC
In the last decade, the Damascene
process of electrodepositing copper25
has supplanted evaporated aluminum
for forming the conducting pathways
between the individual semiconductor
devices of integrated circuits. With an
appropriate combination of additives
(accelerators, suppressors, and levelers),
electrodeposited metals can superfill
the small (tens of nanometers), high
aspect ratio features found in modern
integrated circuits without forming voids
or seams.
Although traditional leveling models
were initially applied to this process,
they failed to account for the unique
features of bottom-up superfill that make
Damascene viable for this application.
The process works because the metal
is deposited superconformally, filling
from the bottom of a feature faster
than on the sides or the surface of the
wafer, to such a degree that a bump
actually forms over the top of a trench
or via (known as momentum plating).
The curvature enhanced accelerator
coverage (CEAC) mechanism has been proposed26–29 to explain the phenomenon
of electrodeposited superfill. The essence
of the model is that when a suppressor,
such as polyethylene glycol (PEG), is
displaced by an accelerating surfactant such as SPS (Na2(S(CH2)3SO3)2), faster deposition occurs in regions of higher
accelerant coverage and that an advancing
concave surface will tend to concentrate
this accelerant while an advancing
convex surface will tend to dilute it.
The velocity of the growing interface
is directly related to the total current
passing through it, which is the sum of
the partial currents ij mediated by each additive j. Each ij is assumed to depend on the applied overpotential π and the additive surface concentration Θj through a relation like Equation 7, commonly called the Butler–Volmer equation. i°j = i°(Θj) is the exchange current and αj = α(Θj) characterizes the symmetry of the forward and reverse reactions, insert C is the concentration of cupric ions at the electrode surface and CCU2+ is the cupric concentration in the far-field. In
its simplest form, the conservation for
the accelerant a is governed by Equation
8, where the right-hand side is the key to
the mechanism, with concave curvature κ
leading to increasing surface coverage of
accelerant (inducing even faster growth
of the concave surface) and convex κ
leading to decreasing surface coverage.
The CEAC model has also been extended
to treat surface diffusion, adsorption, and
finite additive consumption.
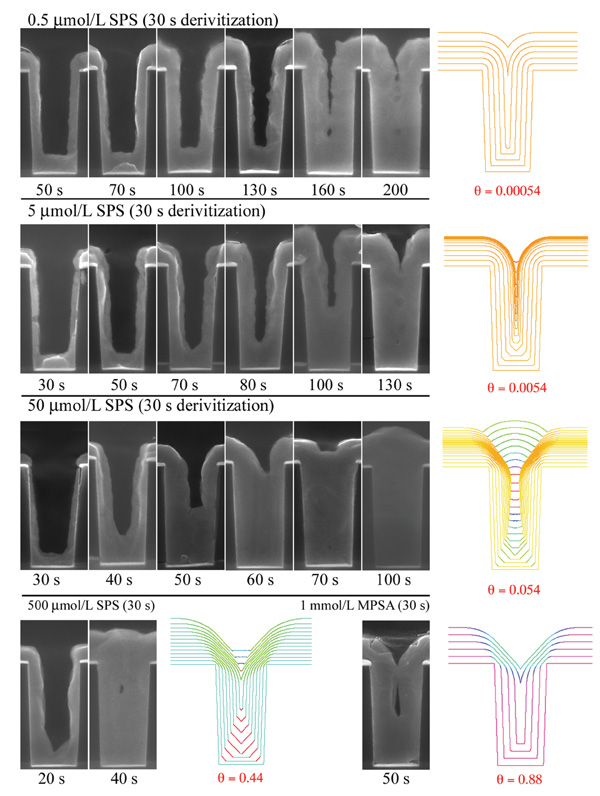
The exchange current i° and the reaction symmetry α are determined
by fitting voltammetric and chronoamperometric
experiments performed on
planar electrodes. These parameters are
then used, without further adjustment,
when modeling filling of features of
different aspect ratios. The electrode
surface is advanced, using the level set
technique, in accordance with the current
passed in Equation 7. This model
has enjoyed considerable success in
predicting desirable superfill versus void
and seam formation in the electroplating
of copper, as illustrated in Figure 7. The
same mechanism has also been found to
describe the electrodeposition of silver
and gold, as well as the chemical vapor
deposition of copper.30
Modeling the Double Layer
When transport in the electrolyte
does not control deposition kinetics,
phenomena in the double layer create
non-ohmic (nonlinear) charge transfer
kinetics. G.M. Gouy31 and D. Chapman32 undertook the first attempt to model the
double layer. They treated the electrode
as an impenetrable boundary with some
imposed potential at its surface and
assumed that ions in the electrolyte obey
a Boltzmann distribution and that the
electrostatic potential was coupled to
the distribution of charges via Poissons
equation (Ñ • ηÑφ = ρ, where ρ is the local charge density). The result was a
prediction for the distribution of ions
in the electrolyte, the decay length of
the electrostatic potential, and relationships
between the applied potential and
the surface energy of the electrode, the
charge on the surface of the electrode,
and the differential capacitance of the
charged layers. It is interesting to note
that the Gouy and Chapman treatments
of the electrochemical interface predate
the more widely known Debye–Hückel33 model of charged interfaces by a
decade.
One weakness of the Gouy–Chapman
model, corrected by O. Stern,34 was that
they assumed ions to be infinitesimal
points, allowing them to pack without
constraint near the electrode surface.
Among other things, this caused the
differential capacitance to diverge to
infinity as the imposed surface potential
(or surface charge) was increased.
By accounting for the finite size of the
ions, Stern showed that the differential
capacitance could be considered as two
capacitors in series, one as predicted by
Gouy–Chapman at low biases and another
of constant capacitance that dominates
at high biases, when ions at the surface
reach their packing limit.
Although the Gouy–Chapman–Stern
(GCS) model captures the qualitative
characteristics of the double layer, it
does not account for many of the details
of real electrochemical interfaces. This
has motivated the development of more
sophisticated computational models
similar to GCS, but which capture more
of the details observed in experimental
studies.
Recent density functional treatments,
such as those of Z. Tang et al.,35 have
expanded on the essential elements of
the GCS model and demonstrated rich
electrocapillary behavior reminiscent of
experimental measurements. Like GCS,
these density functional models cannot
treat electroplating or electrodissolution
because the electrode is just a simple
abstraction provided as a boundary condition
to the model.
J.E. Guyer et al.36,37 noted the many
analogies between electrodeposition
and solidification, where the phase
field method has enjoyed considerable
success, and developed a phase
field treatment of the electrochemical
interface. This treatment considered the
same basic physics as the GCS and Tang
models, but also allowed for the plating
or dissolution of the electrode. They
considered four components: cations,
anions, solvent, and electrons. All species
had the same molar volume, except
electrons were assumed to have no molar
volume, allowing them to move freely in
the electrode without having to displace
other species. Although an inert electrochemical
interface could be modeled
with three components in this formalism,
four are necessary to describe plating or
dissolution. All species were assumed
to obey ideal solution thermodynamics
(equivalent to the Boltzmann distribution
assumed in GCS). They included
the electrostatic contribution to the total
free energy and showed that the phase
field gradient energy coefficient and
the dielectric constant are completely
analogous, one penalizing gradients in
the phase field and the other penalizing
gradients in the electrostatic potential.
They did not similarly penalize gradients
in concentration.
The simplest set of assumptions was
made, consistent with conserving each
species and minimizing free energy, to
obtain the governing equations for the
model. In the absence of variations in the dielectric constant, the treatment of
the phase field is identical to that used
by Shibuta et al.4,5 and by Powell et al.6–12 Diffusion equations were obtained in the manner of Equation 1, with fluxes defined by  for electrons and for electrons and  for all species other than electrons and species N (chosen arbitrarily). They related the mobilities Mj to the diffusivities Dj and defined gradients of the electrochemical potential of species j by Equation 9. for all species other than electrons and species N (chosen arbitrarily). They related the mobilities Mj to the diffusivities Dj and defined gradients of the electrochemical potential of species j by Equation 9.
For each component j, Wj is the energy barrier of the activated state and ÑμjΒ is the standard chemical potential difference between the electrode and electrolyte. Vm is the molar volume. ÑμjΒ depends on
the standard state bulk concentrations in
each phase and on the Galvani potential Ñφ° (the difference between the internal
potential or work function of the electrode
and that of the electrolyte). Although
really a property of the electrode material
and electrolyte chemistry, the Galvani
potential is an adjustable parameter in
this model that dramatically affects the
structure of the double layer.
The model solves the phase field and
diffusion equations in conjunction with
Poissons equation. The fundamental
difference from GCS or the Tang model
is that the same set of equations govern
both the electrolyte and the electrode, the
difference being that Guyer et al. chose
thermodynamic parameters to favor an
electrode rich in cations and electrons and
an electrolyte rich in solvent, cations, and
anions. They consider both a charge-free
solvent as a simple model of aqueous
solutions (while ignoring the important
effects of polar solvent molecules) and a
charged solvent system as a simple model
of molten salts.
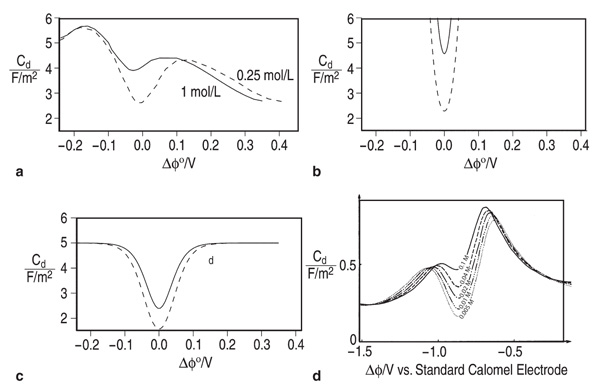
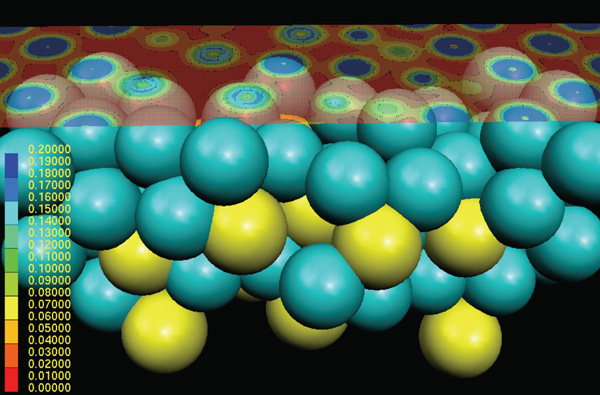
When studying electrode-electrolyte
interfaces at open circuit (in equilibrium),
Guyer et al. found that sweeping the
Galvani potential (effectively changing
the electrode material) produced changes
in surface energy, surface charge, and
differential capacitance that were qualitatively
consistent with the electrocapillary
theory for sweeping the voltage applied to an inert electrode. [VIEW ANIMATION] As
seen in Figure 8, however,
the detailed predictions are
markedly different from the GCS models
but bear a striking resemblance to the
behavior observed in experimental studies of solid metal electrodes.
On examining moving interfaces (plating
or dissolution), Guyer et al. showed
that the model yields expected behavior such as limiting current and
alloy plating. [VIEW ANIMATION] Most dynamic models
of electrodeposition, including
the level set treatment described, assume
that the ButlerVolmer equation governs
the relationship between current and overpotential
and use it to evolve the shape of
the interface. This model assumed a linear
relationship between phase evolution
rate and driving force, but gave rise to a
non-linear relationship between current
and overpotential, consistent with the
empirical Butler Volmer relation. This
is the power of phase field: simple physical
relationships, applied rigorously, give
rise to complex phenomena, but without
having to hypothesize complex origins.
Although the model is not intrinsically
limited to one dimension, higher
dimensions have proven computationally
intractable without choosing a number
of unphysical parameters. Reasons for
this include very small Debye length
(separation between charged planes in the
double layer) requiring very fine spatial
resolution, and abrupt changes in concentration
of many orders of magnitude in
order to capture an intuitively acceptable
approximation of a real metal-electrolyte
interface (i.e., no water in the electrode,
no free electrons in the water). Although
not considered in this treatment, the
anisotropy of adsorption behavior on
different crystallographic surfaces can
be incorporated in the thermodynamic
derivation of a phase field model.
The phase field treatments of Powell et
al. and Shibuta et al. avoid these difficulties
(at the loss of some details about the
interface) by replacing Poissons equation
with Laplaces and by modeling a different
set of concentration variables that do
not experience such extreme changes in
magnitude. It remains to be seen if the
approaches can be successfully merged
to model larger systems, in higher dimensions,
while retaining the electrocapillary
phenomena of the double layer.
Summary
Meso-scale models provide important
insights into physical phenomena at the
scale of dendrites and microfabricated
features. They are thus useful as design tools for engineers seeking to avoid or
utilize spontaneous roughness formed
by electrodeposition. Continuum theories
can even shed new light on nanometerscale
phenomena such as the electrochemical
double layer. However, many of
these models require parameters that are
very difficult to measure, such as homogeneous
free energy at compositions
which are not homogeneous, and bonding
energies. For these parameters and
fundamental understanding at smaller
scales, we turn to atomistic models.
ATOMISTIC MODELS
Atomistic and first-principles methods
help provide insight into processes that
occur on the atomic or subatomic scale
in order to better understand fundamental
processes, aid in the design of materials,
and estimate parameters for use in
other models. For example, they can be
used to examine the formation of adlayers
at interfaces during electrodeposition
and properties of the electrical double
layer that forms due to charge separation,
and they can be used to calculate materials
parameters such as the binding energy
of an atom on a surface. These methods
provide information about atomic- and
electronic-scale phenomena that is
unavailable from models on larger length
and time scales. However, they can also
be limited by small sizes, short times,
and the dependence of results on the
physical approximations used in the
calculations. The computational methods
of interest include molecular simulation techniques such as Monte-Carlo (MC)
and molecular dynamics (MD), and
electronic structure, or first-principles,
methods.
Monte-Carlo simulations are grounded
in a statistical-mechanical treatment of
particles where system evolution is based
on how random moves (such as changes
in atomic coordinates) affect the state of
the system. Equilibrium (or static) MC
methods cannot be associated with real
time, but kinetic (or dynamic) MC methods
use attempt frequencies of moves to
relate the simulation evolution to physical
time.39 Classical MD techniques solve
Newtons equations of motion to model
the evolution of particles (usually atoms)
under conditions such as constant temperature.40 Since MC moves are not tied
to particle trajectories, it is often possible
to treat larger systems for longer periods
of time than can be achieved with MD,
though the two techniques can be used
in parallel or in series for some problems.
First-principles (or ab-initio) methods
use quantum-mechanical descriptions of
atoms to calculate materials properties
and examine chemical reactions (e.g.,
Reference 41). First-principles methods
provide very detailed information about
individual atoms, but the computational
cost is high, leading to small system sizes.
This section is intended to provide
examples of interesting work and is not
exhaustive.
To understand the origins of ordered
overlayers and surface phase transitions,
first-principles and atomistic simulations
have been used in combination with
experimental methods such as cyclicvoltammetry
and chronocoulometry.
These systems can be viewed as model
systems for the interfaces between electrodes
and aqueous electrolytes. A review
of the behavior and importance of ordered
anion adlayers on metal electrode surfaces
can be found in Reference 42. Using
kinetic MC and equilibrium MC, the
origins of ordered overlayers and surface
phase transitions have been examined.
For example, N. Garcia-Araez et al.
recently compared dynamic MC simulations
and mean-field approximations with
experimental results to examine the
competitive adsorption of hydrogen and
bromine on Pt(100), finding that the MC
results could adequately model the
system, but that the mean-field approach
could not.43 S. Frank and P.A. Rikvold
studied how lateral adsorbate diffusion
affects first-order phase transitions in a
two-dimensional Ising lattice gas model
with attractive nearest-neighbor interactions.44 Some models have coupled MC
simulations with continuum models in
order to bridge size and time scales such
as in the study of a potential step test in
a copper sulfate bath to examine electrodeposition
and electrodissolution of
copper at an electrode.45 Materials parameters
used to parameterize the interatomic
interactions, such as binding energies
between atoms, have been calculated with
ab-initio methods and often compared
with experimental methods.
While the double layer is a phenomenon
of great interest, continuum models
provide little insight into the atomic-scale
mechanisms at interfaces such as the
orientation of the dipolar water molecules
and the effect of ions on interfacial structure.
Many theoretical and simulation
(including MC and MD) studies have
examined the double layer (e.g., References
4650). Recently P. Taboada-Serrano
et al. examined mixtures of symmetric
and asymmetric electrolytes near
discretely charged planar surfaces using
MC methods to examine the effects of
surface charge distribution and asymmetry
in charge and size on the structure
of the double layer, finding that the thickness
and ionic distribution in the double
layer were strongly affected by them.51
C. Hartnig and M.T.M. Koper used MD
to simulate ion transfer reactions of
chlorine in water at metal electrodes,
where they found that solvent reorganization
related to the electron transfer and
ion transfer behaved differently—the first
was dominated by long-range electrostatics
while the latter was influenced by
shorter-range solvent effects.52
As mentioned, ab-initio methods have
been used to calculate materials parameters
(cohesive energies, preferred binding
sites, etc.) and to examine electrochemical
reactions. The information
gained from these methods can then be
used to inform higher-level simulations
and models for a more complete understanding
of electrochemical interfaces.
For example, Z.C. Wang et al.53 have been
studying the electrical properties of the
Ag/Ag2S/Ag junction nanometer-scale
switch mentioned previously. They used
density functional theory and a nonequilibrium
Greens function method to
calculate current-voltage characteristics,
as shown in Figure 9. A. Migani et al.
studied halogens on low-index surfaces
of transition metals, calculating atomic
structure, adsorption energies, vibrational
frequencies, and net charges.54 While the
halogen study was performed in vacuum,
with results to be extrapolated to aqueous
solutions, C. Taylor et al. studied electrochemical
reactions at the Ni(111)/H2O
interface to determine interfacial structure
and when water and its activation
products are stable.55 Further review of
work related to aqueous/metal interfaces
can be found in Reference 56.
Atomic- and molecular-scale methods
have become much more useful for both
the design of materials and the fundamental
understanding of materials
behavior. Coupled with models on higher
length scales and compared with experimental
results, they can provide a more
complete picture of electrochemical
behavior.
CONCLUSION
Electrochemistry plays several key
roles in metallurgy, including processes
for extracting and fabricating metals at
all length scales. In terms of extraction,
it will likely grow in importance as the
price of carbon emissions tips the balance
from carbothermic to electrochemical
processes in some applications. Models
such as those described in this paper will
play an increasing role in the rapid design
and development of these processes.
Furthermore, these models are useful
for studying corrosion and designing a
wide range of electrochemical devices.
Batteries come to mind here, as do hybrid
photo-electric hydrolysis devices for
generating hydrogen and electrochemical
solar cells. For all of these applications,
models can provide understanding and
predict behavior to inform intelligent
design of new devices and products.
ACKNOWLEDGEMENTS
Adam Powell would like to thank Donald Sadoway and James Warren for discussions that influenced this work, and much of Pongsaksawad and Powell’s meso-scale work described here was supported by the National Science Foundation (Award DMI-0457381) and a Royal Thai Government Fellowship. Yasushi Shibuta would like to thank Prof. T. Suzuki, Prof. S. Yamaguchi, and Mr. Y. Okajima (The University of Tokyo) for their help in modeling and calculations, and MEXT, Japan for financial support of the Grant-in-Aid for Scientific Research on Priority Area “Nanoionics (439).” Chandler A. Becker would like to thank the National Research Council-National Academy of Sciences Postdoctoral Research Associate program for support. We are grateful to Tom Moffat and Daniel Wheeler for many helpful comments on this manuscript.
REFERENCES
1. Max Planck, “Ueber die Erregung von Electricit¨at und Wärme in Electrolyten,” Ann. Physik. u. Chem., 39 (1890), p. 161.
2. Elsyca, www.elsyca.com/.
3. The identification of any commercial product or trade name does not imply endorsement or recommendation by the National Institute of Standards and Technology.
4. Y. Shibuta, Y. Okajima, and T. Suzuk, “A Phase-Field Simulation of Bridge Formation Process in a Nanometer-Scale Switch,” Scripta Materialia, 55 (2006), pp. 1095–1098.
5. Y. Okajima, Y. Shibuta, and T. Suzuki, “Phase-Field Simulation of an Electrodeposition Process,” Electrochemistry and Thermodynamics on Materials Processing for Sustainable Production: Masuko Symposium, ed. Shu Yamaguchi (Tokyo: The University of Tokyo, 2006), pp. 829–834.
6. David Dussault, “A Diffuse Interface Model of Transport Limited Electrochemistry in Two-Phase Fluid Systems with Application to Steelmaking” (S.M. Thesis, Massachusetts Institute of Technology, Department of Mechanical Engineering, January 2002).
7. David Dussault and Adam C. Powell, “Phase Field Modeling of Electrolysis in a Slag or Molten Salt,” Proc. Mills Symp. (London: The Institute of Materials, 2002), pp. 359–371.
8. Adam C. Powell and David Dussault, “Detailed Mathematical Modeling of Liquid Metal Streamer Formation and Breakup,” Metallurgical and Materials Processing Principles and Technologies (Yazawa International Symposium)–Vol. 3: Aqueous and Electrochemical Processing, ed. F. Kongoli et al. (Warrendale, PA: TMS, 2003), pp. 235–250.
9. Wanida Pongsaksawad, Numerical Modeling of Interface Dynamics and Transport Phenomena in Transport-Limited Electrolysis Processes (Ph.D. Thesis, Massachusetts Institute of Technology, Department of Materials Science and Engineering, May 2006).
10. Adam C. Powell, Wanida Pongsaksawad, and Uday B. Pal, “Phase Field Modeling of Phase Boundary Shape and Topology Changes Due to Electrochemical Reactions in Solid and Liquid Systems,” Advanced Processing of Metals and Materials Vol. 3: Thermo and Physicochemical Principles: Special Materials; Aqueous and Electrochemical Processing (Warrendale, PA: TMS, 2006), pp. 623–640.
11. Adam C. Powell, Wanida Pongsaksawad, and Uday B. Pal, “Phase Field Modeling of Phase Boundary Shape and Topology Changes Due to Electrochemical Reactions in Solid and Liquid Systems,” Electrochemistry and Thermodynamics on Materials Processing for Sustainable Production: Masuko Symposium, ed. Shu Yamaguchi (Tokyo: University of Tokyo, November 2006), pp. 793–814.
12. Wanida Pongsaksawad, Adam C. Powell, and David Dussault, “Phase Field Modeling of Transport-Limited Electrolysis in Solid and Liquid States,” J. Echem. Soc., 154 (6) (June 2007).
13. S.G. Kim, W.T. Kim, and T. Suzuki, “Phase-Deld Model for Binary Alloys,” Phys. Rev. E, 60 (6) (1999), pp. 7186–7197.
14. K. Terabe et al., “Formation and Disappearance of a Nanoscale Silver Cluster Realized by Solid Electrochemical Reaction,” J. Appl. Phys., 91 (12) (2002), pp. 10110–10114.
15. T. Sakamoto et al., “Nanometer-Scale Switches Using Copper Sulfide,” Appl. Phys. Lett., 82 (18) (2003), pp. 3032–3034.
16. Y. Sawada, A. Dougherty, and J.P. Gollub, “Dendritic and Fractal Patterns in Electrolytic Metal Deposits,” Phys. Rev. Lett., 56 (12) (1986), pp. 1260–1263.
17. F. Sagues, M.Q. Lopez-Salvans, and J. Claret, “Growth and Forms in Quasi-Two-Dimensional Electrocrystallization,” Physics Reports, 337 (2000), pp. 97–115.
18. G. Gonzalez et al., “Viscosity Effects in Thin-Layer Electrodeposition,” Journal of the Electrochemical Society, 148 (7) (2001), pp. C479–C487.
19. C. Leger, J. Elezgaray, and F. Argoul, “Internal Structure of Dense Electrodeposits,” Phys. Rev. E, 61 (5) (2000), pp. 5452–5463.
20. M. Matsushita et al., “Fractal Structure of Zinc Metal Leaves Grown by Electrodeposition,” Phys. Rev. Lett, 53 (3) (1984), pp. 286–289.
21. J. Elezgaray, C. Leger, and F. Argoul, “Dense Branching Morphology in Electrodeposition Experiments: Characterization and Mean-Field Modeling,” Phys. Rev. Lett., 84 (14) (2000), pp. 3129–3132.
22. M.O. Bernard, M. Plapp, and J.F. Gouyet, “Mean-Field Kinetic Lattice Gas Model of Electrochemical Cells,” Phys. Rev. E, 68 (2003), p. 011604.
23. Y. Shibuta, Y. Okajima, and T. Suzuki, in preparation.
24. D.P. Barkey, R.H. Muller, and C.W. Tobias, “Roughness Development in Metal Electrodeposition: II. Stability Theory,” J. Electrochem. Soc., 136 (1989), pp. 2207–2214.
25. P.C. Andricacos et al., “Damascene Copper Electroplating for Chip Interconnections,” IBM J. Res. Develop., 42 (5) (1998), pp. 567–574.
26. D. Josell et al., “Superconformal Electrodeposition in Submicron Features,” Phys. Rev. Lett., 87 (1) (2001), p. 016102.
27. D. Wheeler, D. Josell, and T.P. Moffat, “Modeling Superconformal Electrodeposition Using the Level Set Method,” J. Electrochem. Soc., 150 (5) (2003), pp. C302–C310.
28. T.P. Moffat, D. Wheeler, and D. Josell, “Superfilling and the Curvature Enhanced Accelerator Coverage Mechanism,” Interface (Winter 2004), pp. 46–52.
29. T.P. Moffat et al., “Superconformal Film Growth: Mechanism and Quantification,” IBM J. Res. Develop., 49 (1) (2005), pp. 19–36.
30. D. Josell, D. Wheeler, and T.P. Moffat, “Superconformal Deposition by Surfactant-Catalyzed Chemical Vapor Deposition,” Electrochemical and Solid State Letters, 5 (3) (2002), pp. C44–C47.
31. G.M. Gouy, “Sur la Constitution de la Charge Électrique à la Surface d’un Électrolyte,” Compt. Rend., 149 (1910), p. 654.
32. David Leonard Chapman, “A Contribution to the Theory of Electrocapillarity,” Phil. Mag., 25 (1913), p. 475.
33. P. Debye and E. Hückel, “Zur Theorie der Elektrolyte I. Gefrierpunktserniedrigung und verwandte Erscheinungen,” Physik. Z., 24 (1923), pp. 185–206.
34. Otto Stern, “Zur Theorie der Elektrolytischen Doppelschicht,”Z. Elektrochem., 30 (1924), p. 508.
35. Zixiang Tang, L.E. Scriven, and H.T. Davis, “A Three-Component Model of the Electrical Double Layer,” J. Chem. Phys., 97 (1992), pp. 494–503.
36. J.E. Guyer et al., “Phase Field Modeling of Electrochemistry I: Equilibrium,” Phys. Rev. E, 69 (2004), p. 021603.
37. J.E. Guyer et al., “Phase Field Modeling of Electrochemistry II: Kinetics,” Phys. Rev. E, 69 (2004), p. 021604.
38. G. Valette, “Double Layer on Silver Single Crystal Electrodes in Contact with Electrolytes Having Anions Which are Slightly Specifically Adsorbed Part II. The (100) Face,” J. Electroanal. Chem., 138 (1982), pp. 37–54.
39. M.E.J. Newman and G.T. Barkema, Monte Carlo Methods in Statistical Physics (Oxford, U.K.: Clarendon Press, 1999).
40. D.C. Rapaport, The Art of Molecular Dynamics Simulation, second edition (Cambridge, U.K.: Cambridge University Press, Cambridge, 2004).
41. D.G. Pettifor, Bonding and Structure of Molecules and Solids (Oxford, U.K.: Clarendon Press, 1995).
42. O.M. Magnussen, “Ordered Anion Adlayers on Metal Electrode Surfaces,” Chem. Rev., 102 (2002), pp. 679–725.
43. N. Garcia-Araez et al., “Competitive Adsorption of Hydrogen and Bromide on Pt(100): Mean-Field Approximation vs. Monte Carlo Simulations,” J. Electroalytical Chem., 588 (2006), pp. 1–14.
44. S. Frank and P.A. Rikvold, “Kinetic Monte Carlo Simulations of Electrodeposition: Crossover from Continuous to Instantaneous Homogeneous Nucleation within Avrami’s Law,” Surf. Sci., 600 (2006), pp. 2470–2487.
45. A. Saedi, “A Study on Mutual Interaction between Atomistic and Macroscopic Phenomena during Electrochemical Processes Using Coupled Finite Difference–Kinetic Monte Carlo Model: Application to Potential Step Test in Simple Copper Sulfate Bath,” J. Electroanalytical Chem., 588 (2006), pp. 267–284.
46. R. Guidelli, “Recent Developments in Models for the Interface between a Metal and an Aqueous Solution,” Electrochimica Acta, 45 (2000), pp. 2317–2338.
47. W.R. Fawcett and T.G. Smagala, “New Developments in the Theory of the Diffuse Double Layer,” Langmuir, 22 (2006), pp. 10635–10642.
48. E. Spohr, “Some Recent Trends in Computer Simulations of Aqueous Double Layers,” Electrochimica Acta, 49 (2003), pp. 23–27.
49. R.R. Netz, “Theoretical Approaches to Charged Surfaces,” J. Phys. -Cond. Matter, 16 (2004), pp. S2353–S2368.
50. M.T.M. Koper, “Combining Experiment and Theory for Understanding Electrocatalysis,” J. Electroanalytical Chem., 574 (2005), pp. 375–386.
51. P. Taboada-Serrano, S. Yiacoumi, and C. Tsouris, “Behavior of Mixtures of Symmetric and Asymmetric Electrolytes Near Discretely Charged Planar Surfaces: A Monte Carlo Study,” J. Chem. Phys., 123 (2005), p. 054703.
52. C. Hartnig and M.T.M. Koper, “Molecular Dynamics Simulation of Solvent Reorganization in Ion Transfer Reactions near a Smooth and Corrugated Surface,” J. Phys. Chem. B, 108 (2004), pp. 3824–3827.
53. Z.C. Wang et al., in preparation.
54. A. Migani and F. Illas, “A Systematic Study of the Structure and Bonding of Halogens on Low-Index Transition Metal Surfaces,” J. Phys. Chem. B, 110 (2006), pp. 11894–11906.
55. C. Taylor, R.G. Kelly, and M. Neurock, “First-Principles Calculations of the Electrochemical Reactions of Water at an Immersed Ni(111)/H2O Interface,” J. Electrochemical Soc., 153 (2006), pp. E207–E214.
56. C.D. Taylor and M. Neurock, “Theoretical Insights into the Structure and Reactivity of the Aqueous/Metal Interface,” Current Opinion in Solid State and Materials Science, 9 (2005), pp. 49–65.
Adam C. Powell IV is managing engineer at Veryst Engineering LLC, 47A Kearney Rd., Needham, MA 02494-2503, USA. Yasushi Shibuta is an assistant professor at The University of Tokyo, 7-3-1 Hongo, Bunkyo-ku, Tokyo 113-8656, Japan. Jonathan Guyer and Chandler A. Becker are materials research engineers at National Institute of Standards of Technology, Gaithersburg, MD 20899, USA. Dr. Powell can be reached at (781) 433-0433, ext. 12; fax (781) 433-0933; e-mail apowell@veryst.com. |
 Presenting a Web-Enhanced