 Presenting a Web-Enhanced Presenting a Web-Enhanced Article from JOM |
 LATEST ISSUE |
|||
TMS QUICK LINKS: |
• TECHNICAL QUESTIONS • NEWS ROOM • ABOUT TMS • SITE MAP • CONTACT US |
JOM QUICK LINKS: |
• COVER GALLERY • CLASSIFIED ADS • SUBJECT INDEXES • AUTHORS KIT • ADVERTISE |
|
| Research Summary: Large Datasets in Materials Science, Part I | Vol. 63, No.3 pp. 30-34 |
at Submicron Length Scales
R.I. Barabash, H. Bei, G.E. Ice, Y.F. Gao, and O.M. Barabash
Questions? Contact jom@tms.org. |
|
Renewed interest in composite materials is driven by the fact that their mechanical properties can be superior to those of individual constituent phases. Interfaces between the phases and the properties of individual phases are the two key elements responsible for the unique micro-mechanisms of plastic deformation in composites. In this research summary we show how the depth-dependent residual strain distributed in the two phases and partitioned across the composite interfaces can be directly measured at submicron length-scales using x-ray microdiffraction and compared to a detailed simulation within the framework of micromechanical stress analysis. Interface strength is determined from the analysis of the so-called "slip zone" caused by the near-surface stress relaxation. Two examples are discussed: Mo-NiAl and AG-15 composites.
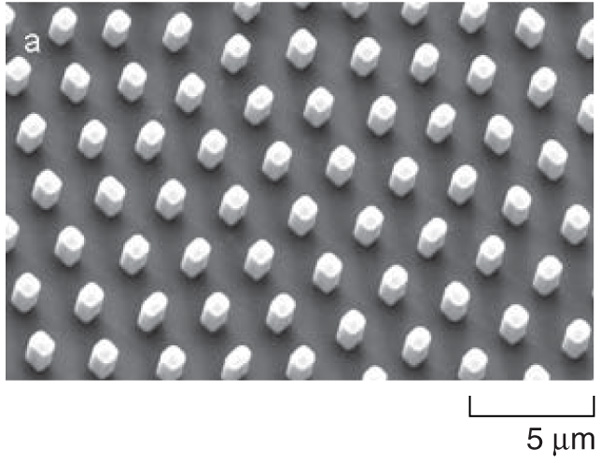
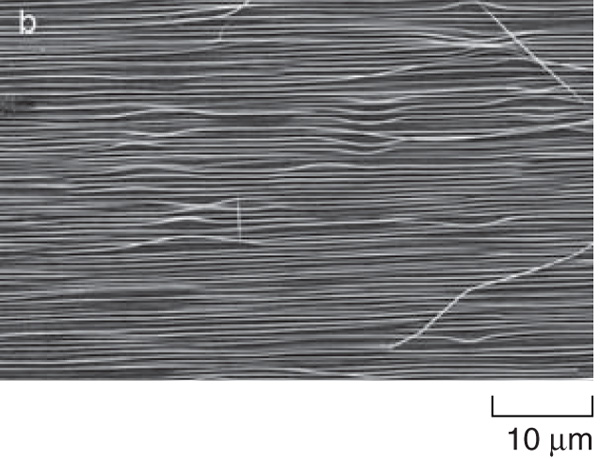
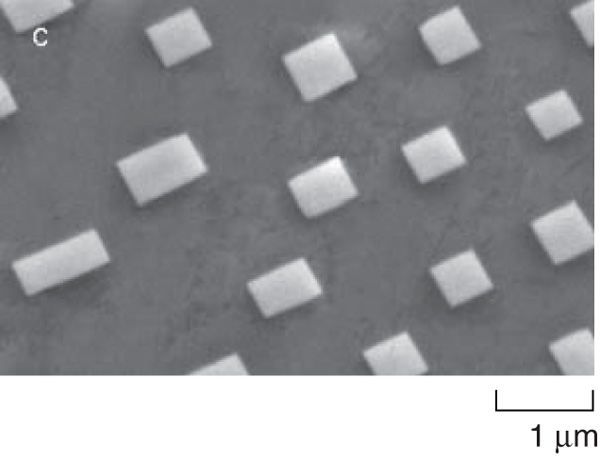
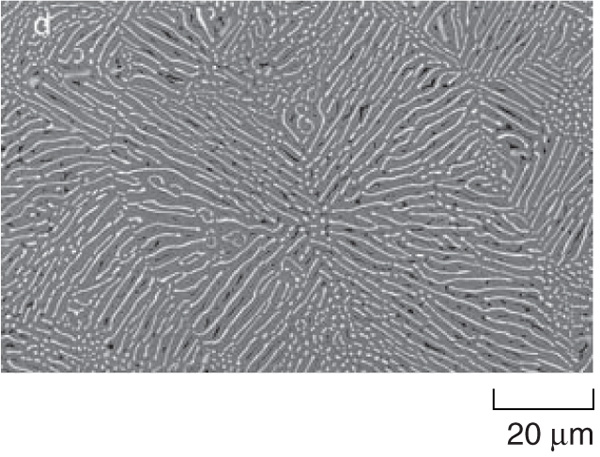
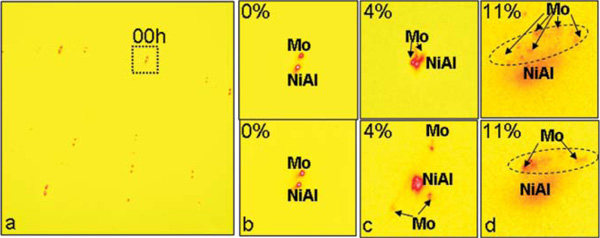
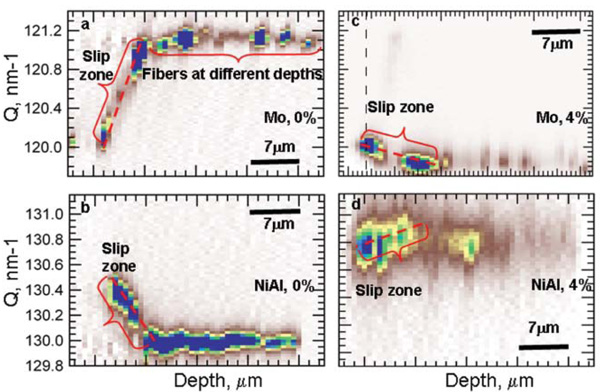
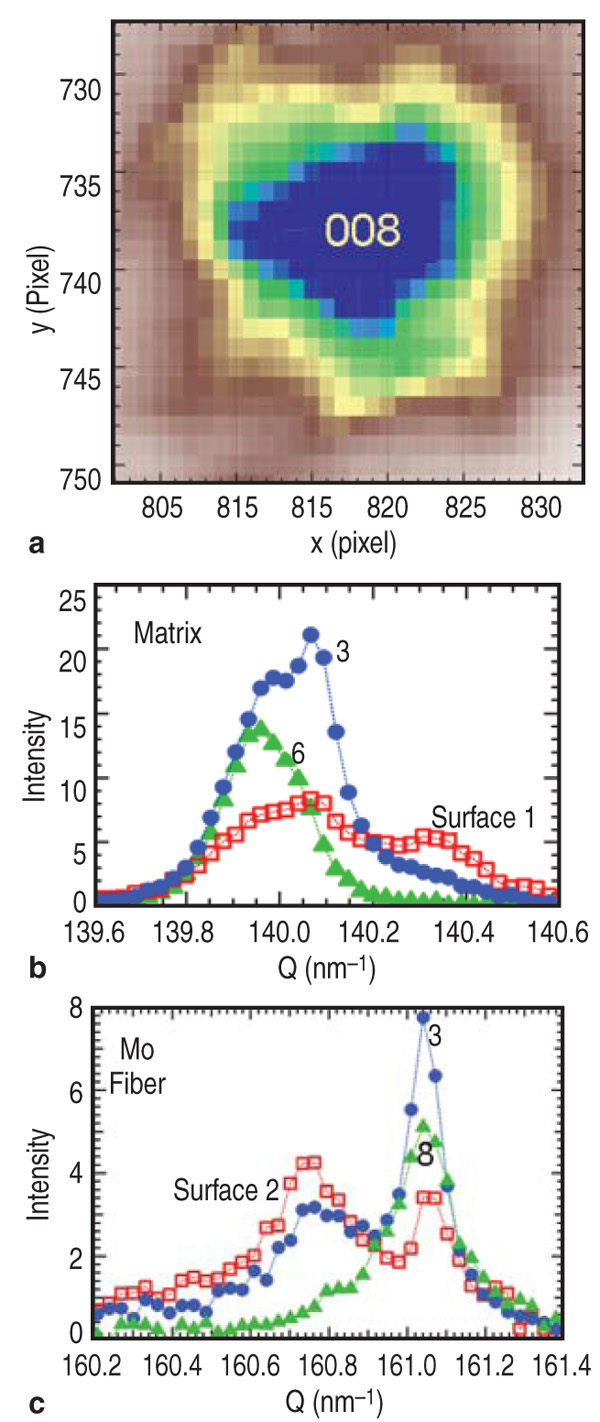
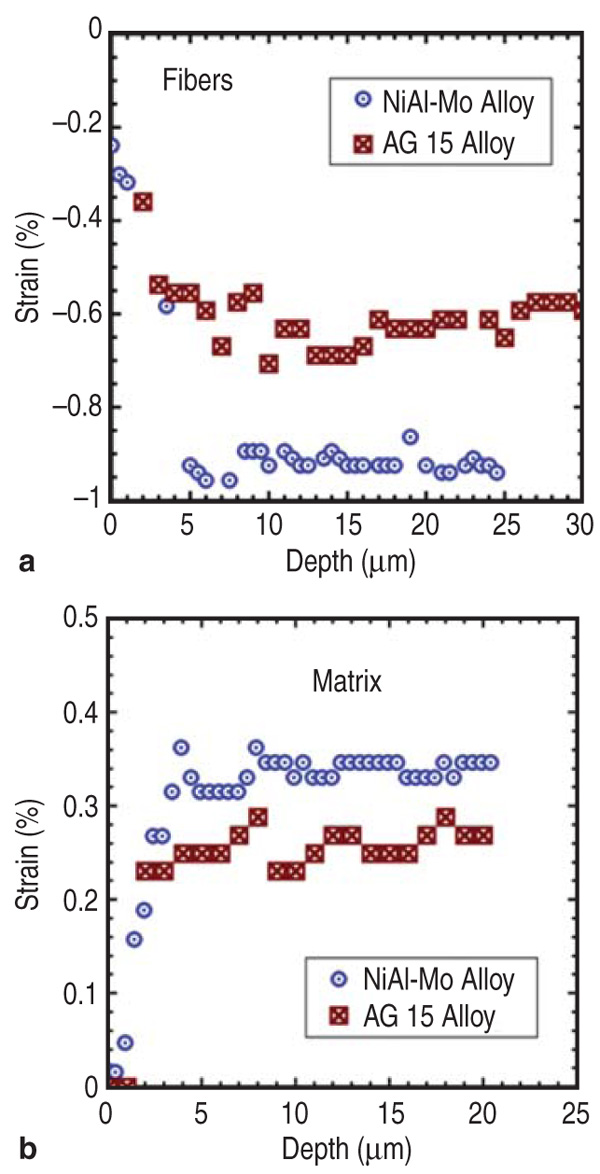
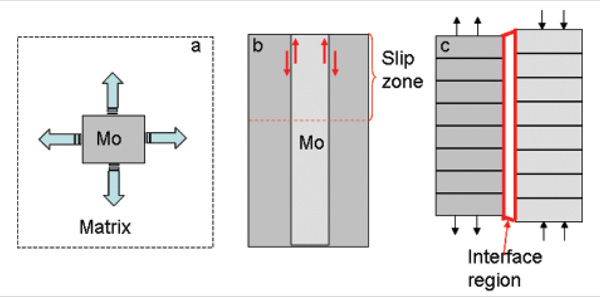
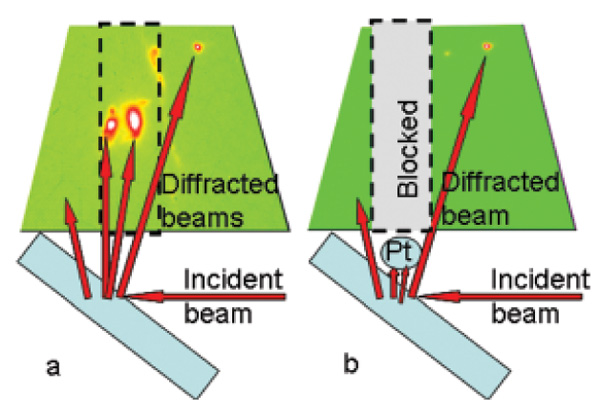
Many advanced structural materials are composites which combine the desirable properties (e.g., strength, and toughness) of individual phases.1 Among various composites, the fibrous metal/metal composite is one of the most important types. It is distinct from other multiphase materials due to the high directionality in one dimension along the fiber direction. There are two key elements to determine the overall mechanical properties of a composite: the interfaces between the phases and the properties of the individual phases. For example, the coefficient of thermal expansion (CTE) of a composite determines its overall length change upon heating or cooling, whereas the CTEs of its constituent phases partially determines thermal residual stresses. Similarly, a modulus mismatch between the constituent phases may result in mechanically induced residual stresses. These thermal and mechanical stresses are of interest because they can have deleterious effects, including interface debonding, cracking, and elastic/plastic deformation of the constituent phases. Besides the properties of the individual phases, the interface between the phases also plays an important role in composite materials, because the interface strength is important for determining how the strain is partitioned among the different phases under external load.1,2 The importance of the interfaces should increase as the interface fraction increases as the constituent phases become smaller and smaller (e.g., in nanocomposites). To understand mechanical behavior near interfaces, it is critical to develop nondestructive techniques that can characterize defect distributions and local mechanical behavior at appropriate length scales. Recently, significant progress in the development of nondestructive x-ray beam probes has been made with unprecedented submicron resolution and with the ability to nondestructively characterize the local crystal structure in small sample volumes.3–7 In this research summary we describe how the depth-dependent residual strain distributed in the two phases and partitioned across the composite interfaces can be directly measured at a submicron length-scale using x-ray microdiffraction and compared to a detailed simulation within the framework of micromechanical stress analysis. We focus on the interface behavior, and residual strains relaxation between the Mo-fibers and the matrix near the surface of directionally solidified (DS) Mo-NiAl and AG15 composites. Preliminary measurements of the elastic strains using the polychromatic x-ray microbeam (PXM) technique indicated the presence of strain gradients in both composites.3–5 In the as-grown state after directional solidification the model composites consist of long Mo fibers regularly distributed in the NiAl or AG15 matrix.8–11 Cross section and longitudinal microstructures of the Mo/NiAl composite are shown in Figure 1a and b. The aspect ratio of the fiber length/diameter is ~200. The AG15 composite has a similar microstructure with the size of the fibers ~0.7 μm and spacing between the fibers ~1.5 μm (Figure 1c). Depending on the growth conditions and microdoping, the Mo phase shape can change shape from fiber to lamellae in the AG15 matrix (Figure 1d). In both model composites the Mo fibers and the matrix solidification growth directions are along the <001> direction. In Mo-NiAl composite the facet planes follow the relationship (110)Mo||(110)NiAl. In the AG15 composite the facet planes may deviate from the (110)Mo||(110)matrix relationship.12 Initial structure analysis in Mo-NiAl and AG15 eutectic composite alloys in the as-grown state and after deformation was performed with PXM.13–15 A typical Laue pattern of the Mo-NiAl composite in the as grown state is shown in Figure 2a. In the as-grown state both model composites show high alignment between the fibers and the matrix. Misorientation of <001> growth directions between different fibers and the matrix does not exceed 0.3°. In the Laue measurements the crystal lattice planes with the same orientation in either fibers or the matrix diffract x-rays in the same directions of reciprocal space. As a result, their Laue spots practically coincide as shown by the two closely spaced spots in Figure 2b. Due to low defect density in the fibers and the matrix, their Laue spots are sharp and have small full width at half maximum (FWHM). Deformation results in broadening and streaking of the Laue spots due to the formation of geometrically necessary dislocations (GNDs).15 The enlarged regions around (00h)-type Laue spots are shown in Figure 2b, c, and d at two different locations for the as-grown state (0%), and after 4% and 11% preliminary compressive strain (pre-strain). In the as grown state orientation of the Mo fibers and the matrix is very stable and does not change from location to location (Figure 2b). After 4% deformation, the misorientation between different fibers and the matrix increases. Due to the inhomogeneity of plastic deformation, a stochastic distribution of fiber misorientations is observed, resulting in much larger (~ 3–5°) fiber rotations in different (sometimes opposite) directions (Figure 2c), and indicating the formation of GNDs necessary to accommodate such rotations. Formation of dislocations in metal/metal composites during deformation was previously described computationally in the framework of discrete dislocation analysis.16 After 11% deformation, matrix reflections become much broader and practically at all locations large fiber rotations are observed (Figure 2d). These observations are consistent with the stochastic mechanical behavior of Mo pillars at 4% strain observed in the NiAl/Mo composites.17 Analysis of interface strength and depth-dependent strain distribution in Mo-NiAl and AG15 eutectic composite alloys in the as-grown state and after deformation was performed using differential aperture x-ray microscopy (DAXM) with monochromatic radiation. The depth-resolved d-spacing distribution was measured with an energy-scan method.4,5,13 The energy was scanned in 3-eV steps over a range of ~140 eV through (006) reflections of Mo and NiAl matrix in the Mo-NiAl composite and, in the range of 296 eV through (008) reflections of Mo and matrix in the AG15 composite. At each energy step the Pt wire was displaced with a step of 1 μm and ~70 partially shadowed images were taken to triangulate the energy value corresponding to each depth. Using a ray-tracing algorithm, the inverse lattice parameters Q006 or Q008, with modulus |Q| = 2π/d, at each depth were determined from these measurements for Mo/NiAl or AG15 composites, respectively. Strains and depth-dependent strain gradient distributions in the slip zone were further calculated from these results. Figure 3 shows depth-dependent inverse lattice parameters Q006 for individual phases of the Mo-NiAl composite in the as-grown state (Figure 3a and b) and after 4% preliminary compressive strain (pre-strain) (Figure 3c and d). Large near-surface strain gradients are observed in the as-grown state in Mo fibers and the NiAl matrix, caused by the release of the residual as-grown strains. Due to coefficient of thermal expansion (CTE) mismatch Mo fibers are under compression and the matrix is under tension along the growth direction. Near the sample surface the stress release results in the formation of the so-called "slip zone," as shown by the varying depth-dependent strain distribution. Strain gradients can be determined from the slope of the curves. Red dashed lines are shown as a guide for the eyes to follow the strain gradients in the alloy constituents. Strain gradients have opposite signs in the two phases. Deformation causes partial stress relaxation, which results in the increase of the slip zone size, and decrease of the slopes of the depth-dependent strain gradient. The size of the slip zone is inversely related to the strength of the interface between the fibers and the matrix. It is evident from the Figure 3 that deformation essentially decreases the interface strength. We have found that when the composite is pre-strained with 4% and 11% compressive strain, the resulting near-surface relaxation leads to a longer slip zone (>15 μm), and the estimated interface strength will be about 10~30 MPa. This is accompanied by a large number of dislocations accumulated near the interface, further confirming that the interface shear strength, τ0, is an average measure of the number of defects adjacent to the interface. In the AG15 directionally solidified composite, the strain gradients in the matrix and the fibers demonstrate similar depth-dependent behavior. To obtain a better depth-dependent resolution, the 008 reflection with higher energy interval was chosen for DAXM energy scans. Figure 4 shows an enlarged region of interest for the 008 reflection and line profiles at three different depths for the matrix and the fibers. Near the surface within the depth range of 1–3 μm line profiles for both the matrix and the fibers have a bimodal intensity distribution typical for the "slip zone." At larger depths single peak profiles are observed. Experimental depth-dependent strain distributions in both composites are compared in Figure 5. In both composites along the growth direction the matrix is under tensile strain while Mo fibers are under compression. In the AG15 MM composite the residual strains in the fibers and the matrix along the growth direction are smaller (in absolute value) than in the NiAl–Mo composite. In both model composites large residual strains were observed in both the fibers and the matrix. Formation of residual strains can be understood in the framework of a simple micromechanical model. A sketch of the Mo fiber in the composite matrix shows the formation of residual tensile in-plane strain in the fibers in the as-grown state due to CTE mismatch (Figure 6a). The as-grown strains in the Mo fiber along the growth direction are compressive. Near the sample surface residual stresses release with the formation of the "slip zone" (Figure 6b). A sketch of the narrow interface transition region with coherency strains between both phases is shown in Figure 6c.
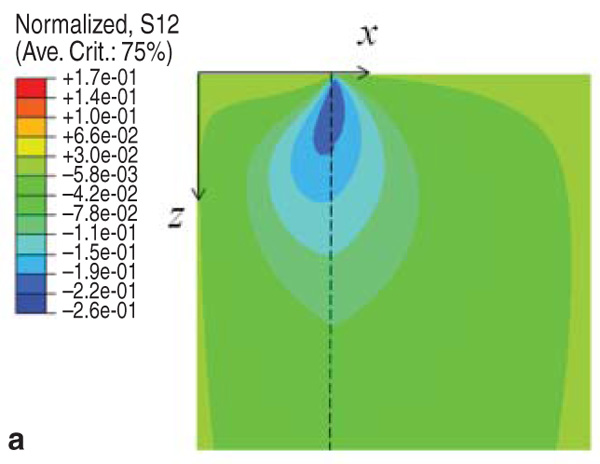
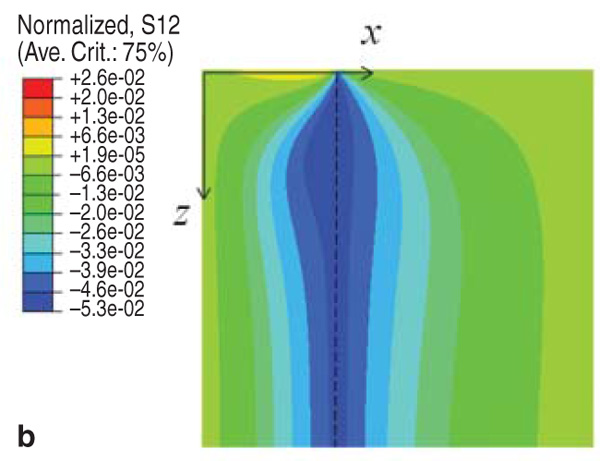
Simulations with the micromechanical modeling allow the residual as-grown stress distribution to be followed as a function of depth from the sample surface and distance between the fibers. Shear stress contours as a function of depth and distance between the fibers are shown in Figure 7. The depth of the sample is along the Z-coordinate, and the X-coordinate is along the distance between the fibers. Simulations were performed for parameters typical for the NiAl/Mo composite. The modeling results confirm the experimental observations. Interface strength estimatedfrom the above depth-dependent strain distributions is 180 MPa for NiAl/Mo composite. The detailed description of the micromechanical modeling can be found in the Reference 18. See the sidebar for experimental background. Interface strength between the Mo fibers and the matrix is governed by two major factors.
This research was supported by the Materials Sciences and Engineering Division, Office of Basic Energy Sciences, U.S. Department of Energy. X-ray microbeam measurements were performed at the 34-ID-E at the Advanced Photon Source. The use of the APS was supported by the Scientific Users Facilities Division, Office of Basic Energy Sciences, U.S. Department of Energy. We gratefully acknowledge Dr. J. Vitek (ORNL) for most valuable comments and suggestions.
1. N. Chawla and K.K. Chawla, Metal Matrix Composites (New York: Springer, 2006). R.I. Barabash and O.M. Barabash, research professors, H. Bei, staff member, and G.E. Ice, ORNL Corporate Fellow and Acting Director, are with the Materials Science and Technology Division, Oak Ridge National Laboratory, Oak Ridge, TN 37831; R.I. Barabash, O.M. Barabash, and Y.F. Gao, assistant professor, are with the Materials Science and Engineering Department, University of Tennessee, Knoxville, TN 37996; Gao is also with the Computer Science and Mathematics Division, Oak Ridge National Laboratory, Oak Ridge, TN 37831. Dr. R.I. Barabash can be reached at barabashr@ornl.gov. |