|
Directional solidification of nickel-based single crystals requires control
of the heat transfer, fluid flow, and
phase transformations at the solidliquid
interface during withdrawal in the
Bridgman process. While the morphological
details of the dendritic structure
at the solidliquid interface influence
defect formation processes, there is an
incomplete understanding of this structure
as a function of alloy composition
and processing conditions. A three-dimensional
serial sectioning and image
reconstruction approach for characterization
of the solidification front has
been developed and structural characteristics
of the dendritic structure are
quantified.
INTRODUCTION
Nickel-based superalloys are commonly
used in their single-crystal form
in the production of turbine blades for
industrial gas turbines and aircraft engines.
Reliable mechanical performance
of these single crystals in the turbine
environment requires that no high
angle boundaries, including stray
misoriented grains or freckles, be present
as casting defects in the component.
Not only are these components costly
to fabricate, the service cost associated
with repairing or replacing these
components is expensive as well.
As
such, the prevention of casting defects
is of particular interest. Traditionally,
predictors for the formation of freckles have called upon estimates for the
presence of convective flow,1,2 which
has been identified as the precursory
event for the formation of freckles and
some types of misoriented grains.37
While values for the viscosity, thermal
diffusivity, and other physical properties
governing flow in nickel alloys can,
with effort, be measured experimentally
or computationally assessed,8,9 the dendritic
geometry through which molten
material is flowing has only been evaluated
in relatively small two-dimensional
(2-D) domains.1012 To evaluate
fluid flow processes on a larger scale
in three dimensions, a serial sectioning
and imaging protocol that captures
the dendritic structure at the solidification
front and reconstructs the resulting
microstructure for further analysis has
been developed.
EXPERIMENTAL PROCEDURE
Within an ALD Vacuum Technologies,
Inc. furnace, a 5.4 kg ingot of the
commercial superalloy René N4 was
directionally solidified in conventional
Bridgman mode at the University of
Michigan. The nominal composition
of the ingot was 4.2Al-0.05C-7.5Co-
9.8Cr-0.15Hf-1.5Mo-0.5Nb-4.8Ta-
3.5Ti-6.0W-Ni (wt.%)13 with solidus
and liquidus temperatures confirmed by
differential thermal analysis of 1,300°C
and 1,345°C, respectively.14 A withdrawal
rate of 2.5 mm/min. and thermal
gradient of 40°C/cm was used. During
withdrawal, the investment mold was
fractured to capture the dendritic front
mid-melt by quickly evacuating all remaining
molten liquid from the mold.
A rectangular base plate with a cross-sectional
area normal to the growth direction of 11.5 cm × 3 cm was cast.
Using a slow-speed milling saw, samples
approximately 1 cm3 in size were
extracted from the solidification front.
Samples were then vacuum impregnated
using Buehlers EpoHeat™ thermosetting
epoxy.
The samples were hand polished
parallel to the primary growth direction
down to a 1.0 μm diamond finish for
metallographic documentation of the
structure. A representative sample was
then selected, polished, and imaged using
the prototype RoboMET.3D™ serial
sectioning system at Wright-Patterson
Air Force Base.15 Successive
polishing was performed using Allied
1.0 μm diamond lapping film while
imaging was performed using a Zeiss
Axiovert inverted microscope at 10x.
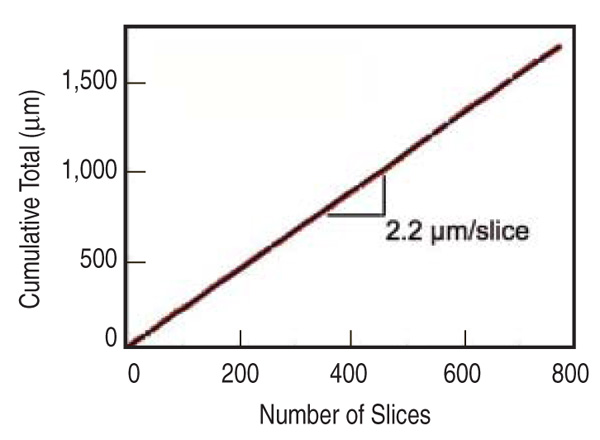
Material removal rates were obtained
by measuring thickness changes in the
sample with a Mitutoyo Absolute™ table-mounted, pneumatic actuator digital
micrometer over image intervals of
seven to ten slices. Average removal
rates observed were 2.2 μm/slice. Material
removal rates are shown in Figure
1. Images were taken congruent to the
polishing plane and parallel to the primary
growth direction. Each slice consisted
of an eight-image montage with
each image possessing a standard resolution
of 0.52 μm/pixel. In raw form,
each slice was 1520 MB in size. A total
of 727 slices were used in this reconstruction
for ~12.6 GB of data. Additional
details of the RoboMET.3D
system have been previously discussed.16,17
Table I. Interdendritic Voids: Range, Magnitudes, and Overall Contribution
|
|
Volume Threshold (mm2)
|
Voxel Threshold
|
No. of Independent Bodies
|
Void Fraction (%)
|
Contribution to Total
Voided Regions (%)
|
|
380,700,000
|
107
|
1
|
97.9
|
97.91
|
|
38,070,000
|
106
|
0
|
0.00
|
97.91
|
|
3,807,000
|
105
|
1
|
0.30
|
98.21
|
|
380,700
|
104
|
16
|
1.15
|
99.36
|
|
38,070
|
103
|
68
|
0.50
|
99.86
|
|
3,807
|
102
|
139
|
0.11
|
99.97
|
|
380.7
|
101
|
273
|
0.02
|
99.99
|
|
38.07
|
10
|
337
|
0.00
|
99.99
|
*Single voxel volume is 38.07 μm3
|
Following serial sectioning, image
segmentation was performed using
ITT Visual Information Solutions Interactive
Data Language (IDL)® along
with Adobe Photoshop® to render each slice a cleaned, binary image properly
aligned for stacking. The segmentation
process consists of seven operations:
image shifting, coarse cropping,
fine cropping, cleaning, conversion to
binary, size setting, and size reduction.
Interactive Data Language was used
primarily for all image refining while
Photoshop was utilized for cleaning
and binary conversion. Although batch
processing was employed for certain
procedures, very little automated segmentation
was employed in the preparation
of this reconstruction; manual
segmentation was the primary method
used. After adequate segmentation, datasets
were converted to three-dimensional
(3-D) arrays for visualization
and evaluation of the dendritic structure
using IDL.
RESULTS
…describe the overall significance
of this paper?
Traditionally, investigation of
the solidification process in
cast structures is performed by
examination of various twodimensional
sections throughout
the casting. Here, an experimental
method for the characterization
of the full three-dimensional
dendritic substructure at the
solid–liquid interface in a
directionally solidified superalloy
is presented and discussed.
…describe this work to a materials
science and engineering professional
with no experience in your
technical specialty?
Understanding the microstructure
of directionally cast superalloys
plays a pivotal role in the ability
to estimate not only the quality
of these components but also
the reliability, lifetime, and any
potential processing defects
within them. Here an
experimental method for
capturing and characterizing the
three-dimensional microstructure
present during directional
solidification is shown.
…describe this work to a layperson?
The overall effectiveness of
turbine blades for aircraft engines
and industrial gas turbines is
very sensitive to the presence of
defects, which can occur during
casting. The most common of these
defects are called “freckles.” This
work employs three-dimensional
reconstructions of the casting
event at the physical location of
transition from molten liquid to
solid. This reconstruction can be
used to more accurately predict
the occurrence of freckles.
|
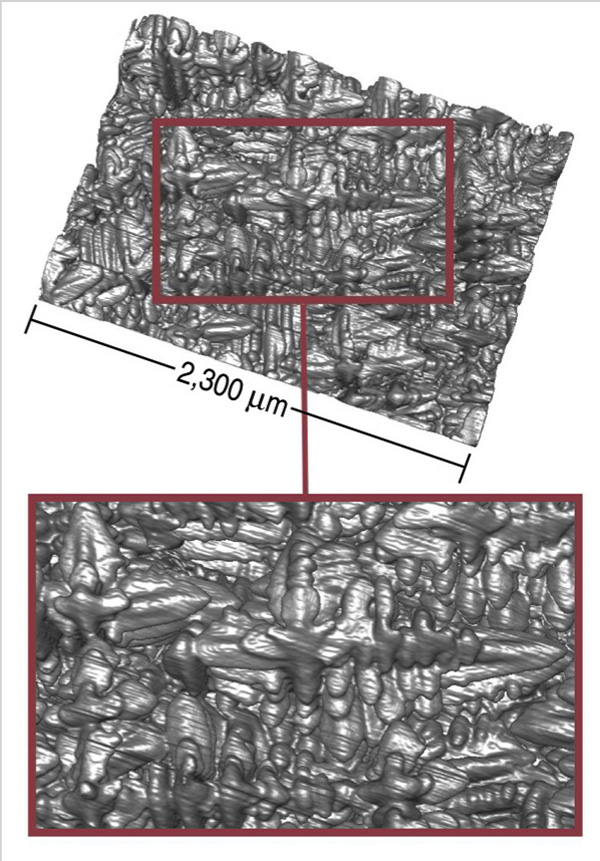
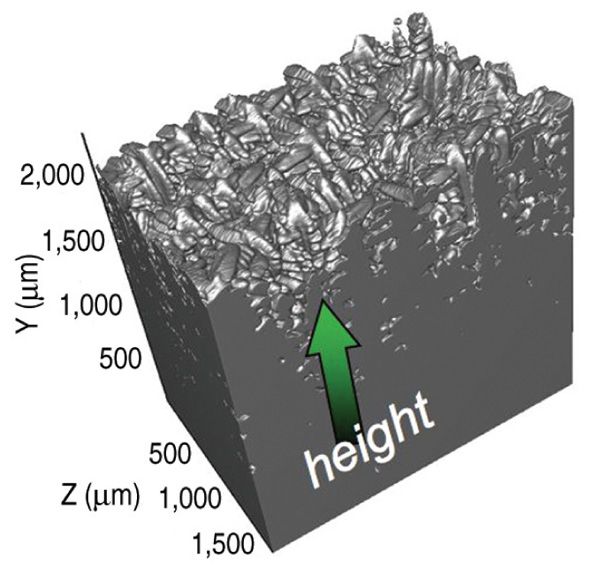
Reconstruction
The fully reconstructed volume measures
2.3 mm × 2.3 mm × 1.5 mm and is shown in Figure 2. The sectioning and imaging
orientations are the xy
plane, which is parallel to the primary
growth direction denoted by the green
arrow. Secondary and tertiary arms
are observable in the reconstruction as
shown in Figure 3.
Dentrite Arm Spacing
Since decanting was employed to
isolate dendritic structures at the solidification front, the degree of departure
from typical solidification behavior is
a reasonable concern. To address this,
dendrite arm spacings at the solidification
front were quantified in the 3-D
section in comparison to conventional 2-D measures. Primary and secondary
dendrite arm spacings (PDAS and
SDAS) vary in a predictable manner
with thermal gradients and withdrawal
rates during solidification1824 and these
parameters are well characterized for
the present experiments. Three independent
methods were used to measure
and compare dendrite arm spacings.
Traditional planar metallography
was employed to polish, image, and
measure material from regions near
the vicinity of the reconstruction to
measure PDAS and SDAS. In this
way, over 1,400 dendrite cores were
counted and more than 30 independent
measures of SDAS were made. In accordance
with the method previously
discussed by A.J. Elliott,25 following
PDAS measurement, a select number
of cores were identifi ed and cut along
their growth direction, providing surfaces
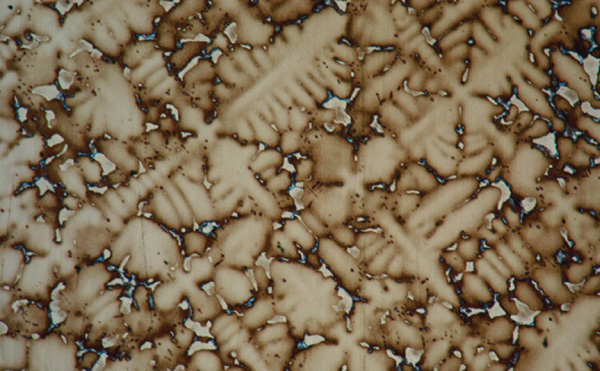
for SDAS measurement. Figures
4 and 5 show two representative optical
micrographs showing primary and
secondary arms from which measurements
were made according to Equations
1 and 2. (All equations are given
in the table.) Here np is the number of
cores counted per cross-sectional area,
L is a predetermined line length located
along the growth direction of a primary
dendrite arm, and n is the number of
secondary dendrite arms intersecting
the line.
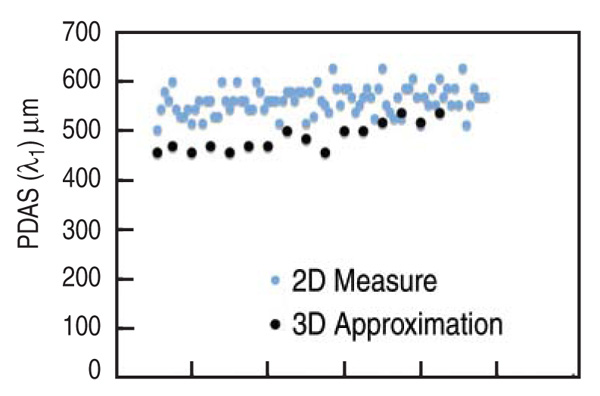
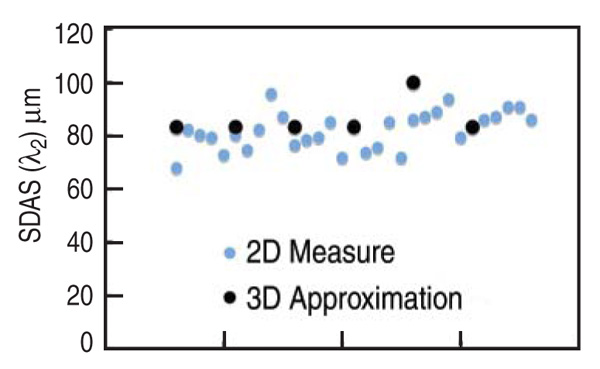
Using these 2-D measures, a PDAS
of 560 + 27.5 μm and an SDAS of 82 +
6.9 μm were obtained.
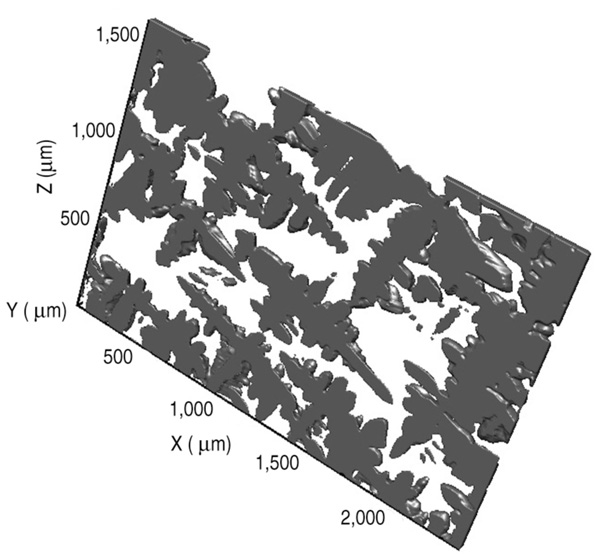
Taking a similar approach with planar
sections of the reconstruction,
PDAS and SDAS were approximated
using the same relationships as above.
Representative images of these planar
cross sections are shown in Figures 6
and 7. Although the reconstructed volume
was somewhat less than the equivalent
2-D volume sampled for PDAS, measurements taken suggest an average
PDAS of 480 ± 28.6 μm and an average
SDAS of 86 ± 6.8 μm. Graphical comparisons
of the 2-D and 3-D measurements
are shown in Figures 8 and 9.
The casting under investigation was
grown under a thermal gradient (G) of
40°C/cm and a growth rate (V) of 2.5
mm/min. Based upon the relationships
between G and V, the expected spacing
of primary and secondary dendrite
arms has been shown to vary according
to the two relationships shown in
Equations 3 and 4.26
Equations
|
|
γ1 = np -1/2
|
(1) |
|
γ2 = L/(n-1)
|
(2) |
|
γ3 ∞ (G-1/2 * V-1/4)
|
(3) |
|
γ2 = (G * V)-1/3
|
(4) |
|
Collections of measurements from
castings produced within the University
of Michigans Bridgman furnace under
similar withdrawal rates with and
without liquid-tin enhanced cooling
were investigated and compared using
the relationship shown in Equations 3
and 4.14 Only in cases of extreme transverse
growth at solidification growth
rates beyond 8.5 mm/min. with liquidtin
coolant did the approximation fail
to correctly predict the dendrite spacing.
Consequently, based upon the processing
conditions, it would be expected
that the PDAS in the sample under
investigation would be in the range of 450600 μm while the SDAS should be
in the range of 6080 μm. These values
indicate good agreement between
not only the 2-D and 3-D measures but
also the expected range based upon G
and V. This suggests that no irregular
artifacts in the dendritic structure have
been introduced as a result of decanting
liquid from the solidification front.
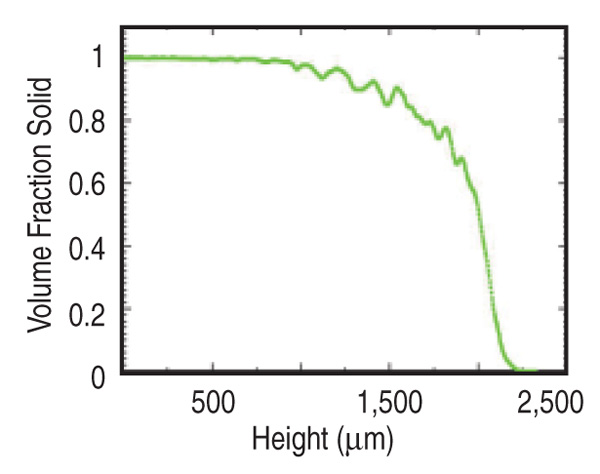
Volume Fraction
The 3-D dataset allows for a direct
measure of the local volume fraction
as a function of height in the mushy
zone; this is shown in Figure 10. While
small fluctuations of solid fraction are
indicative of the local volume fluctuations
due to secondary dendrite arms,
the global trend exhibits a near-parabolic
decrease in volume fraction with
an approximately 80% decrease in volume
fraction to zero over the upper
500 μm of the mushy zone. This is important
since models for convection
in the mushy zone often infer a linear
change in volume fraction as a function
of temperature or height in the mushy
zone during solidification. Additionally,
any property exhibiting a dependence
on volume fraction may in fact
vary drastically over small intervals of
height in the mushy zone. This may
have significant implications for local
fluid flow in these structures.
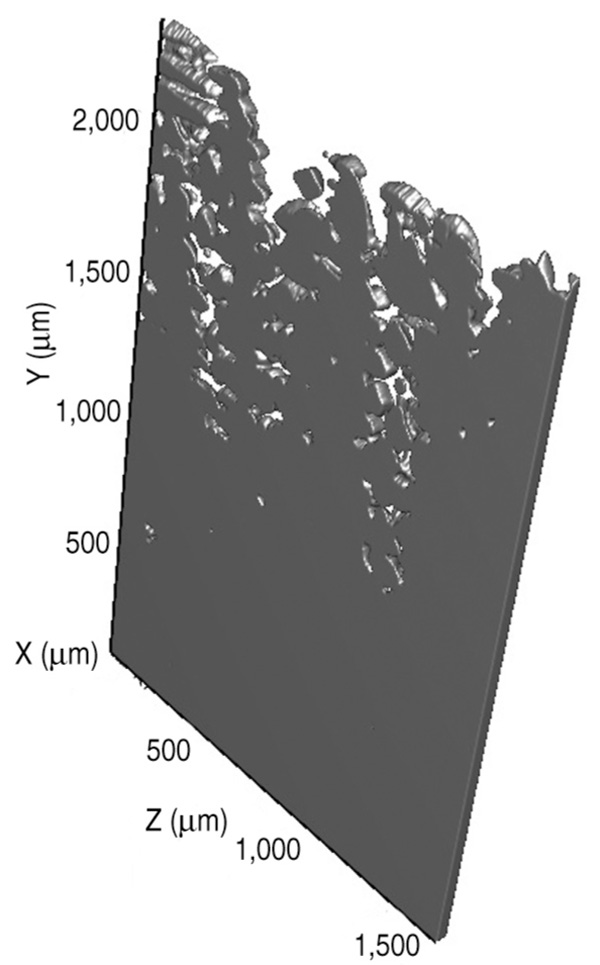
Interdendritic Connectivity
In addition to understanding the gradient
associated with the solid-to-liquid
transition, the degree to which interdendritic
regions are connected to
one another is critical to understanding
the paths for convective flow. Table I
shows an analysis of the interconnectivity
of the voids in the mushy zone,
which quantifies the volumes of interconnected
regions available for fluid
flow during solidification. Independent
interdendritic voids are grouped by descending
volume. This was measured
by reconstructing all non-solid regions
in the reconstruction as shown in Figure
11. It is interesting to note
that the uppermost region is
a single interconnected body
that accounts for roughly
98% of the total voided regions and
reaches down some 900 μm into the
mushy zone.
DISCUSSION
Models for defect formation during
directional solidification typically rely
on Rayleigh criteria to assess the onset
of convective instabilities at the solidliquid
interface during solidification.
15,7,27 The permeability of the
mushy zone, which is sensitive to the
volume fraction of fluid in the mushy
zone, is a parameter that is difficult to
assess but has a strong influence on the
Rayleigh number. The present serial
sectioning and reconstruction method
for characterization of the dendritic
structure provides a path for direct
assessment of permeability. The 3-D
data can be utilized to extend prior 2-D
numerical approaches10,11 to a full 3-D
analysis of the fluid flow; this will be
discussed in future publications.
The automated serial sectioning approach
provided by RoboMET.3D produces
very stringent user repeatability.
Under typical working conditions,
variations in sectioning height are only
produced by irregularity in lapping
films or alterations to user-input polishing
offset height. In this work, the
standard deviation associated with the
2.2 µm/slice sectioning height was
s = + 0.3 µm. Additionally, while the
3-D PDAS measures appear slightly
lower than the 2-D measures for PDAS,
this is likely a result of the limited
cross section available for examination
from the reconstruction.
The more localized SDAS measurements
show a closer agreement, likely
due to similar length scales in the measurements
field of view in both the 2-D
and 3-D approach. Volume fraction
measurements in this René N4 superalloy
tend to suggest the overall height
of the mushy zone that could contribute
to convective flow is much shorter
than typical estimates based upon linear
variations in liquid fraction for the
given imposed thermal gradient. This
could be due to the thermodynamics of
the multi-component alloy in this temperature
range or the complex heat
flow in the mushy zone, or both. Finally,
further analysis of liquid connectivity
and fluid flow in the mushy
zone over a wider range of solidification
conditions could give new insight
to defect formation processes as well
as a better understanding of porosity formation in these single crystal microstructures.
ACKNOWLEDGEMENTS
This research has been supported by
and is in contribution to the Air Force
Offi ce of Scientific Research MEANSII
Program, Grant No. FA9550-05-1-
0104. The authors also acknowledge
useful technical discussions with P.
Voorhees, S. Roper, and S. Davis of
Northwestern University.
REFERENCES
1. C. Beckermann, J.P. Gu, and W.J. Boettinger, Metall.
Mater. Trans. A, 31A (2000), p. 2545.
2. J.R. Sarazin and A. Hellawell, Metall. Trans. A, 19A
(1988), p. 1861.
3. J.C. Heinrich et al., Metall. Trans. B, 20B (1989), p.
883.
4. S. Motakef, J. Crystal Growth, 102 (1990), p. 197.
5. G. Muller, G. Neumann, and H. Matz, J. Crystal
Growth, 84 (1987), p. 36.
6. S. Tin (Ph.D. thesis, University of Michigan, 2001).
7. S. Tin and T.M. Pollock, Metall. Mater. Trans. A, 34A
(2003), p. 1953.
8. F.J. Cherne III and P.A. Deymier, Acta Mat, 39 (1998),
p. 1613.
9. K. Mukai, Z. Li, and K.C. Mills, Metall. Mater. Trans.
B, 36B (2005), p. 255.
10. M.S. Bhat, D.R. Poirier, and J.C. Heinrich, Metall.
Mater. Trans. B, 26B (1995), p. 1049.
11. M.S. Bhat et al., Scripta Metallurgica et Materialia,
31 (1994), p. 339.
12. D.R. Poirier, Met. Trans. B, 18B (1987), p. 245.
13. T.M. Pollock and S. Tin, J. Prop. Power, 22 (2006),
p. 361.
14. A.J. Elliott et al., Metall. Mater. Trans. A, 35A (2004),
p. 3221.
15. J.E. Spowart, H.M. Mullens, and B.T. Puchala,
JOM, 55 (10) (2003), p. 35.
16. B. Maruyama et al., Scripta. Mat., 54 (2006), p.
1709.
17. J.E. Spowart, Scripta. Mat., 55 (2006), p. 5.
18. R.N. Grugel and Y. Zhou, Metall. Mater. Trans. A,
20A (1989), p. 969.
19. S.C. Huang and M.E. Glicksman, Acta Metall, 29
(1981), p. 717.
20. C.M. Klaren, J.D. Verhoeven, and R. Trivedi, Metall.
Mater. Trans. A, 11A (1980), p. 1853.
21. W. Kurz and D.J. Fisher, Acta Metall, 29 (1981),
p. 11.
22. L. Makkon, Mat. Sci. Eng. A, A148 (1991), p. 141.
23. R. Trivedi, Metall. Trans. A, 15A (1984), p. 977.
24. M. Vijayakumar and S.N. Tewari, Mat. Sci. Eng. A,
A132 (1991), p. 195.
25. A.J. Elliott et al., Superalloys 2004, ed. K.A. Green
et al. (Warrendale, PA: TMS, 2004), pp. 421430.
26. M.C. Flemings, Solidification Processing (New
York: McGraw-Hill, Inc., 1974).
27. S. Tin, T.M. Pollock, and W. Murphy, Metall. Mater.
Trans. A, 32A (2001), p. 1743.
J. Madison, graduate student research assistant,
and T.M. Pollock, professor, are in the Materials
Science and Engineering Department, University
of Michigan, Ann Arbor, MI 48109; J.E. Spowart,
senior materials research engineer, is with the
Air Force Research Laboratory/RXLM, Wright-Patterson
AFB, OH 45433-7817; and D.J. Rowenhorst,
metallurgist, is with Naval Research Laboratory,
Washington, DC 20375. Mr. Madison can be reached
at (734) 615-5163; e-mail jonnymad@umich.edu.
|
 Presenting a Web-Enhanced