|
The formation of microporosity during the solidification of aluminum copper alloys was quantified using three techniques: an x-ray temperature gradient stage (XTGS), x-ray microtomography, and mesoscale simulations. The mesoscale simulations solved for the nucleation and diffusion limited growth of both the solid and gas phases from the molten alloy, predicting both the growth kinetics and final morphology of the solid and pores. To experimentally validate this model, an XTGS was used to quantify the pore growth in real time, but only in two dimensions. X-ray microtomography was then performed on the as-cast microstructure to allow three dimensional (3-D) visualization of the final morphology of the pores. A comparison of the predicted and experimentally observed growth rates illustrated the importance of incorporating gas, shrinkage, and curvature effects. The tomographic results illustrated that including the interaction of the gas and solid phases is critical if the tortuous 3-D shapes and maximum sizes are to be predicted.
INTRODUCTION
Aluminum-alloy castings offer a good strength-to-weight ratio at a reasonable cost, resulting in widespread use for components in transport applications. However, for components exposed to cyclic loading, the fatigue behavior of the casting can be limited by the solidification microstructure, especially the presence of microporosity.1–3 This microporosity forms due to a combination of two factors. First, hydrogen in the molten alloy segregates due to its low solubility in the solid phase, resulting in supersaturation in the liquid. Second, there can be insufficient feeding of liquid through the semisolid region to compensate for volumetric shrinkage. More than 50 years ago, E.J. Whittenberger and F.N. Rhines4 illustrated that both of these driving forces contribute to microporosity; however, there is still disagreement on the relative importance of these effects.
|
METHODS
|
X-ray Temperature Gradient Stage
One technique that has been used for decades for in-situ observation of the development of the solidification structures in metals is radiography.8–10 P.D. Lee and J.D. Hunt combined real-time microfocal radiography together with a temperature gradient stage11 to produce a system with independent control of the growth velocity and thermal gradient. This system, termed an x-ray temperature gradient stage (XTGS), allows in-situ quantification of solidification microstructures including porosity.12 With the recent availability of high-flux synchrotron sources, greater temporal and spatial resolution is now possible and several recent in-situ studies have taken advantage of this.13–15
In this study a high-resolution microfocal source (Phoenix x-ray nano-tome) was used to study the solidification of two alloys, Al-4 wt.% Cu and Al-12 wt.% Cu. In each digital frame the individual pores were characterized using two parameters: the maximum pore dimension, Lmax, calculated from the two-dimensional integrated radiographic projection; and the equivalent radius, Req, of the projection. The conditions used are given in Table I.
X-Ray Microtomography
The same two alloys, Al-4Cu and Al-12Cu, were also cast into an instrumented permanent mold wedge casting rig using the methodology described in Reference 3 and the conditions listed in Table I. From a location at the middle of the wedge in thickness, and 100 mm from the bottom, a 2 mm diameter cylinder was machined and analyzed using the same micro-focus source as above, but in tomography mode. An x-ray tube current of 80 μA and acceleration of 80 kV was used, obtaining a pixel size of 4.25 μm. The resulting data sets were quantified using VGStudioMax (VgStudioMax, Volume Graphics GmbH, Heidelberg, Germany) and visualized in Amira (Amira, Mercury Computer Systems, Merignac, France), with Lmax set equal to the diagonal of the rectangular box bounding each pore, while Req was set equal to the radius of a sphere of equal volume to that measured.
Mesoscale Modeling
The computational model used evolved out of the simulation code developed by Lee and Hunt,12,16 where the driving force of hydrogen partitioning and its subsequent diffusion was explicitly solved while the evolution of the microstructure was approximated using the analytic expressions of Hunt and S.Z. Lu.17 In the model of Lee and Hunt, shrinkage effects were incorporated using a local metallostatic pressure which was fixed or approximated via a one-dimensional solution of Darcys Law. This model was significantly extended over the past decade by Lee, R.C. Atwood, and a number of coworkers.18,19 The extensions included the direct simulation of the microstructural evolution by solving for the diffusion limited growth of the solid phase and a front tracking method incorporating cellular automata (CA) and then iterating on the location to solve for local equilibrium. The CA-based rules for first estimate of the front location were based on techniques developed by J.A. Spittle and S.B.R. Brown20,21 and M. Rappaz and C.-A.Gandin22,23. Stochastic nucleation rules were used for the germination of nuclei and pores based on experimentally measured values.24 After nucleation, partitioning-diffusion growth laws are applied and the local pressure is either determined by an analytic equation or by coupling to the macroscopic heat, mass and momentum solver (e.g., Procast, ESI Group, 8, Rue Christophe Colomb 75008 Paris, France; Tel: +33 (0) 15365 1414; Fax: +33 (0) 15365 1412).
In summary, the key features are:
- Stochastic grain density based on local under-cooling
- Stochastic pore density based on local super-saturation
- Grain growth based on solute (copper) partitioning and diffusion in aluminum
- Pore growth based on hydrogen partitioning and diffusion in aluminum
- Interaction between the grain and pore growth based on solute concentration-dependent hydrogen solubility
- Constraint of the pore growth to the interdendritic liquid between dendrites
- Pressure within the pore determined by the local metallostatic pressure (which can be set as constant, determined by an analytic equation or coupling to a macroscopic code [e.g., ProCAST]) and a surface tension curvature term (which is set as a function of the fraction solid, dendrite arm spacing, and pore shape)
These features are all solved in three dimensions, with details of the algorithms given in prior publications. 18,19 The default conditions used in this study are listed in Table I.
|
Recently, a large number of computational models have been proposed that provide a predictive tool to allow castings to be designed with known levels of porosity. Although these models often incorporate only one of the two driving forces, the final percentage porosity formed can be successfully predicted, often over a wide range of solidification conditions (see reviews by P.D. Lee et al. or D.M. Stefanescu).5,6 However, for properties such as fatigue performance, it is the size of the pores rather than just the percentage porosity that can dominate component performance.3 Most of the models do not successfully predict this property.
Indeed, depending on the parameters used when modeling gas and shrinkage forces, including their interaction, very different size distributions and morphologies can be predicted, despite the overall percentage of porosity being similar.7 Methods of elucidating the relative importance are needed. One such method is the visualization and quantification of the pores during their growth. Another is to visualize the final (and often very complex) morphology of individual pores in addition to measuring the average properties. This paper will illustrate how such visualization and quantification can be performed experimentally and computationally using three techniques: an x-ray temperature gradient stage (XTGS), x-ray microtomography (XMT), and mesoscale simulations.
See the sidebar for experimental methods and model description.
RESULTS AND DISCUSSION
X-Ray Temperature Gradient Stage
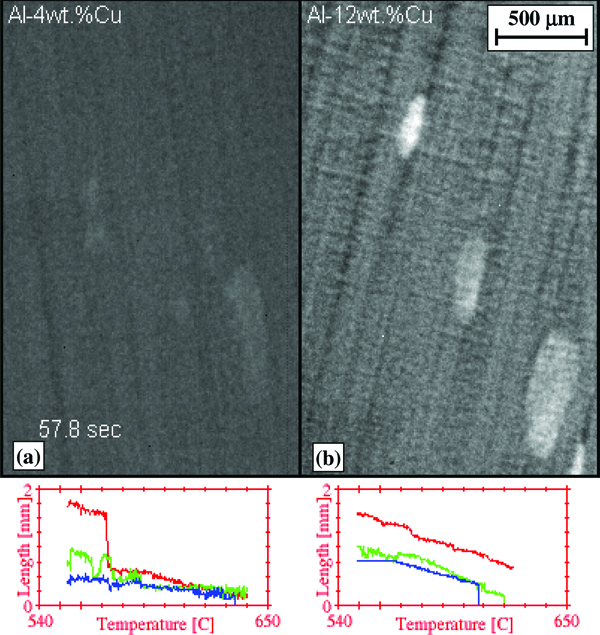
The final solidification microstructure of the Al4Cu and Al12Cu alloys is shown in Figure 1. The digital video associated with this figure shows how the microstructure evolves as a function of time (and reducing temperature), with primary columnar dendrites forming first followed by porosity in the interdendritic regions. Qualitatively, the primary and secondary dendrites are clearly visible in the Al12Cu where there is a large fraction of copper-enriched eutectic formed (Figure 1b). In the Al4Cu the copper-depleted primaries are visible, but the secondary arms are very difficult to resolve from the background noise since the x-ray attenuation variation is low (Figure 1a).
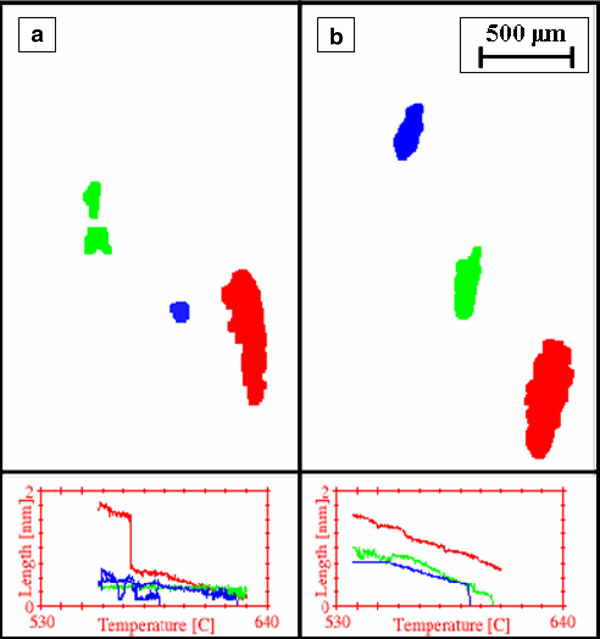
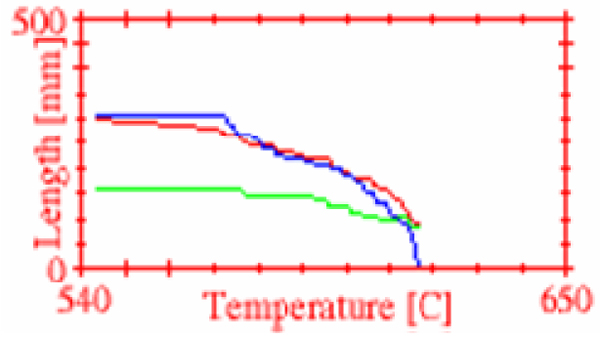
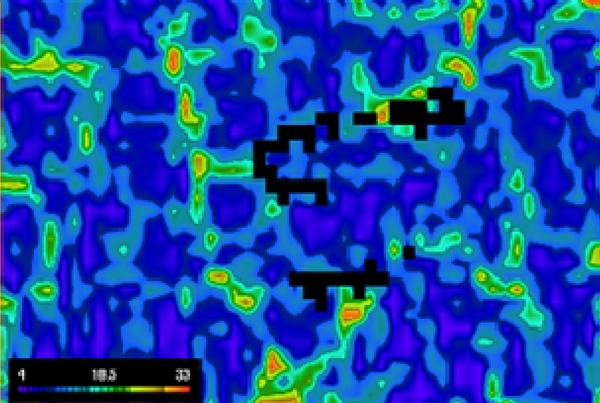
The growth of three pores for each of the copper levels was quantified using image analysis as shown in Figure 2 and the associated filtered digital video. The graphs at the bottom of Figure 2a and b show the evolution of the maximum dimension of each pore, with the colors matching those in the images. For the Al4Cu (Figure 2a), all three pores nucleate at a temperature of approximately 630°C and grow very slowly. One pore (lower right hand side in red) shows a sudden spurt of growth close to the eutectic temperature. The video shows that this pore grows almost entirely in the downward direction (higher fraction solid, fs), suggesting it might be expanding to feed the volume contraction of eutectic below.
In the video the green pore in the upper left hand side of Figure 2a illustrates the complex growth behavior pores can have—this pore grows, splits, the split-off pore disappears and then reappears. The pore on the left hand side also grows upward (toward reduced fs) instead of downward like the larger pore on the right hand side does in its final sudden growth. It should be noted that in the many experiments performed, the most frequently observed growth was into lower fs regions.
For the Al12Cu, the pores nucleate at a much lower temperature (ranging from 610–595°C) but grow more quickly than in Al4Cu (compare Figure 2b and a). All the pores expand in size primarily at the low fs end, expanding in spurts on the same scale as the secondary dendrite arm spacing. Perhaps the pore is constrained by the secondaries, building up pressure in the pore until it can push through to the next gap. Interestingly the overall size of the pores in both is qualitatively similar, although the attenuation contrast between the pores and metal in the Al4Cu is much less than in the Al12Cu. This decrease is more than can be explained by the additional attenuation of the higher copper concentration alloy.
X-Ray Microtomography
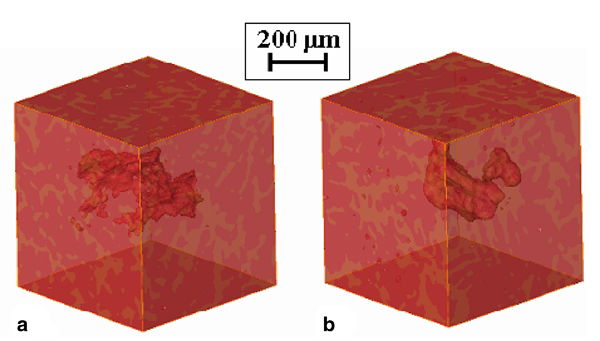
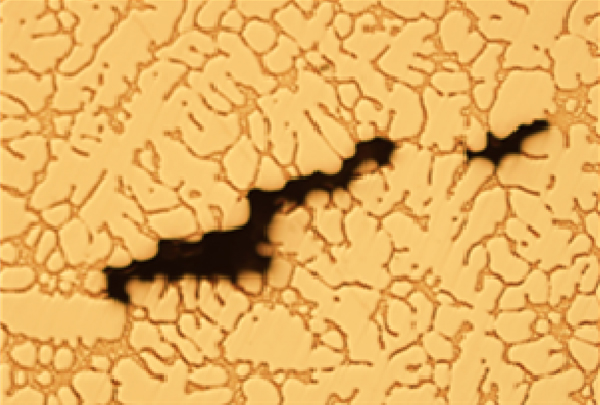
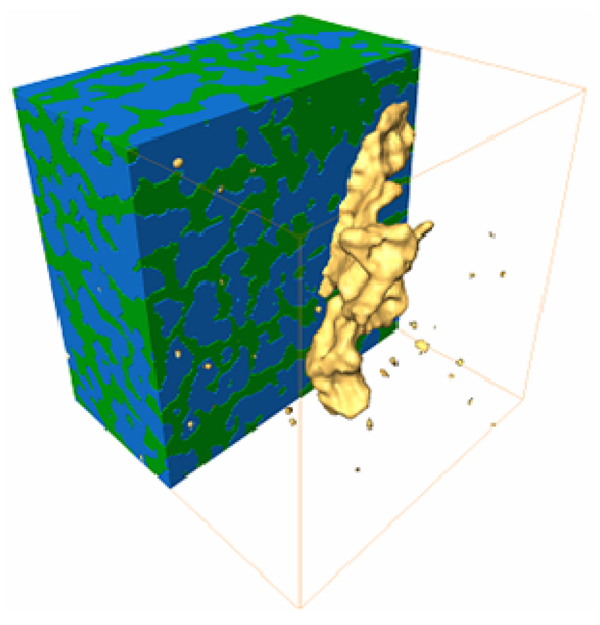
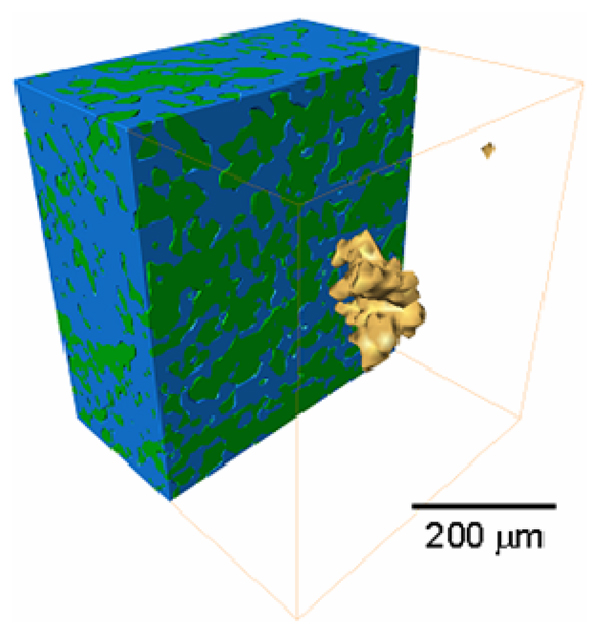
The XMT results for a small child (or subset) volume around a single pore for each of the Al4Cu and Al12Cu alloys are shown in Figure 3. The reason for the reduced contrast between the pores and Al4Cu as compared to the Al12Cu is immediately clear—the pores are much thinner and more tortuous in Al4Cu, although their overall dimensions are similar. In the Al4Cu there is significantly less eutectic, hence the primary dendrites will take up much more of the space, leaving only thinner and more tortuous channels of interdendritic fluid.
The gaps for the pores to fill are much smaller, producing higher curvatures and hence higher surface tension components of the pressure in the pores (although the shrinkage pressure component might be reduced). These high curvatures might lead to a meta-stable situation where the optimum shape of a pore might be borderline between a smaller but rounded shape and a more spread-out shape that has a higher surface-tension component to its free energy—this might have been the case for the left hand side pore in Figure 1a. The pore in the Al12Cu (Figure 3b) is much more rounded due to the significantly larger fraction eutectic (over 30% as compared to a few percent), and hence there are much bigger gaps for the pores to grow into.
In summary, the XMT results show that a model simulating only the growth of spherical pores is not sufficient. It also highlights the difficulties in trying to extract three-dimensional (3-D) attributes such as volume or equivalent radius from two-dimensional (2-D) projections when the shapes are highly tortuous.
Mesoscale Modeling
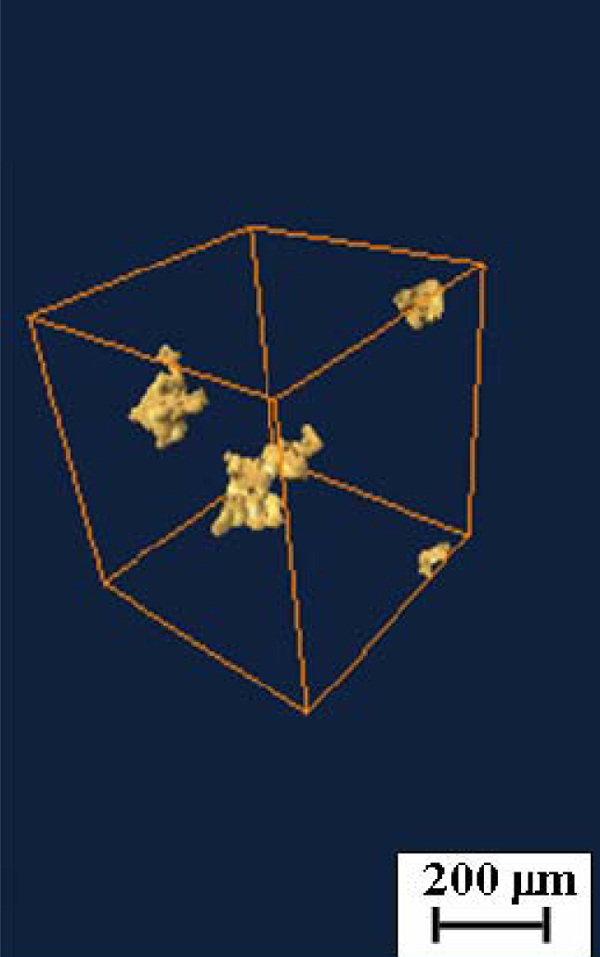
A child volume from a typical mesomodel for Al12Cu alloy and the conditions given in Table II is shown in Figure 4a; the growth rates are given in Figure 4b and c. The simulations match the wedge-casting conditions in the local region where the XMT sample was taken, but not the XTGS experiments, which were directional and at approximately half the cooling rate. Figure 4a illustrates that the model predicts a range of pore sizes and morphologies for each condition, as seen experimentally. Further, Figure 4b and c illustrate that the rate of pore growth can be quantified for each individual pore in terms of the equivalent radius of an equal volume sphere, Req, and the maximum pore length, Lmax. The animation associated with Figure 4 shows how the model simulates stochastic nucleation, grain growth, solute segregation, and the complex evolution of the pore shape due to the interaction of the pores and the solid phases during solidification.
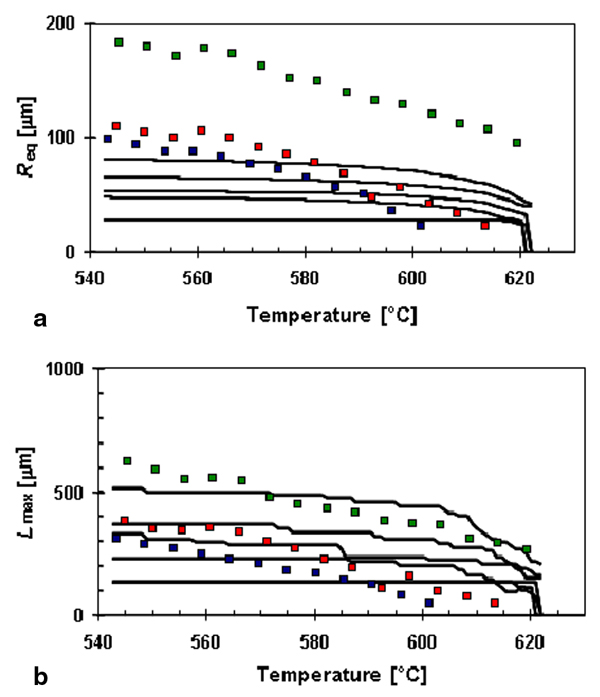
The predicted growth rates for a few selected pores amongst the dozens simulated are compared in Figure 5 to the growth rates of the three pores observed via XMT for the case where the local metallostatic pressure was set as constant, removing the shrinkage driving force. The predicted growth of Req is initially much faster then observed experimentally, but then levels off sooner, underestimating the final pore size (Figure 5a). The Lmax values are compared in Figure 5b, with similar trends although the final predicted maximum dimension of the pores is closer to that observed. Comparing the kinetics of pore formation as well as the final values in Figure 5, it is clear that the model is not incorporating all of the required phenomena.
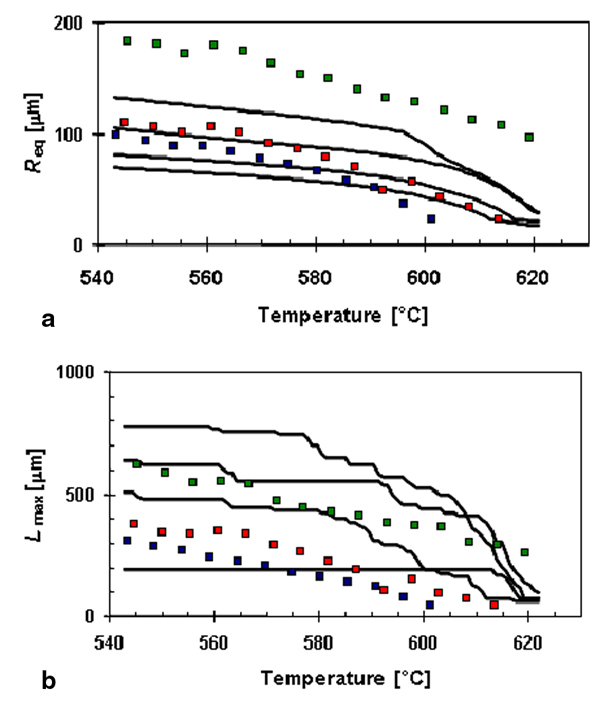
Figure 6 compares the model results incorporating a shrinkage driving force as well as gas. The predicted growth rate of Req is now a much better fit to the XTGS results (Figure 6a) as is the shape of the growth curves for Lmax, although the final values are slightly larger (Figure 6b). Note that the purpose of this comparison is to illustrate the usefulness of comparing model-predicted kinetics of defect formation and not just final size, as the model conditions were for the wedge (equiaxed grains) rather than the XTGS (columnar dendritic). The prediction of like for like (i.e., XMT analysis of wedge casting versus simulation of wedge casting) in terms of final qualitatively 2-D and 3-D morphology is shown in Figure 7 and listed quantitatively in Table II.
By simulating both the gas and shrinkage driving forces the model is able to predict qualitatively the tortuous morphology and quantitatively the final distribution in pore sizes. However, the kinetics of pore growth only has a reasonable match, and model inputs such as pore nucleation potentials are estimated from the XTGS experiments24 rather than explicitly measured. Another factor that significantly alters the growth rates is the treatment of the curvature or interfacial energy terms, which are only calculated via a first-order approximation in the mesomodel. There is still a great need for sophisticated in-situ observations of microstructure and defect formation during solidification, such as high flux and fine resolution synchrotron tomography studies to obtain both greater time and spatial resolution.
Table I. Values Used in the XTGS and XMT Experiments Together with the Default Values Used in the Mesomodel
|
Property |
Symbol |
XTGS |
XMT |
Model |
Units |
Height Imaged/Simulated |
y |
6 |
0.425 |
1.2 or 0.6 |
mm |
Width Imaged/Simulated |
x |
4 |
— |
1.2 or 0.6 |
mm |
Thickness Imaged/Simulated |
z |
1.5 |
0.425 |
1.2 or 0.6 |
mm |
Average Cooling Rate |
R |
1.32 |
2.9 |
2.9 |
°C/s |
Solidification Velocity |
Vs |
0.32 |
— |
— |
mm/s |
Thermal Gradient |
G |
4.09 |
— |
— |
°C/mm |
Hot Stage Temperature |
Thot |
705 |
— |
— |
°C |
Cold Stage Temperature |
Tcold |
505 |
— |
— |
°C |
Hydrogen Content |
CoH |
— |
0.28 |
0.28 |
mL STP/100g |
Grid Spacing |
Δx=Δy=Δz |
8 |
4.25 |
25 or 12 |
μm |
Time Step |
Δt |
— |
— |
250 or 57 |
μs |
Minimum Hydrogen Supersaturation at Nucleation |
Snuc |
— |
— |
1.2 |
— |
Potential Pore Nucleus Density |
ρn |
— |
— |
40024 |
mm–3 |
Hydrogen Solubility |
SH |
— |
— |
as given in Lee & Hunt 16 |
mL STP/100g |
Effective Hydrogen Diffusivity |
De |
— |
— |
as given in Lee and Hunt16 |
mm2/s |
Hydrogen Partition Coefficient |
kH |
— |
— |
0.116 |
— |
Initial Copper Concentration |
C0Cu |
4 or 12 |
4 or 12 |
4 or 12 |
wt.% |
Liquid Density |
ρl |
— |
— |
2.3816 |
g/cm3 |
Solid Density |
ρs |
— |
— |
2.5216 |
g/cm3 |
All-Hg Interfacial Energy |
γ |
— |
— |
9016 |
Pa cm |
Metallostatic Pressure |
Plocal |
— |
— |
101,325 or f(T) |
Pa |
Liquidus Temperature |
Tliq |
— |
— |
648 or 629 |
°C |
Solidus/Eutectic Temperature |
Tsol |
— |
— |
548 |
°C |
Liquidus Slope |
mL |
— |
— |
–3.5 or –3.9 |
|
Equilibrium Partition Ratio Al-Cu |
kCu |
— |
— |
0.17325 |
|
Eutectic Concentration |
Ceut |
— |
— |
32.725 |
wt.% |
Fraction Eutectic |
fe |
— |
— |
0.05 or 0.325 |
— |
|
Table II. Quantitative Comparison of XMT Analysis and Simulation of Al12Cu Wedge Castings
|
|
%P |
Nv |
Lmax |
| |
|
mm–3 |
μm |
XMT |
0.4 |
14 |
863 |
Mesomodel |
0.4±0.2 |
20±7.1 |
720±160 |
|
CONCLUSIONS
A comparison of the predicted and experimentally observed growth rates illustrates the importance of incorporating gas, shrinkage, and curvature effects. X-ray microtomography of the final as-cast microstructures allows the qualitative comparison of the final 3-D pore morphology. It illustrates that including the interaction of the gas and solid phases is critical if the tortuous 3-D shapes and maximum sizes are to be predicted and that assuming the pores are spherical is not sufficient.
ACKNOWLEDGEMENTS
The authors would like to acknowledge support for this work from the Ford Motor Company and the EPSRC (EP/C536312). One of the authors (Junsheng Wang) acknowledges financial support from Ford through a Dorothy Hodgkin Postgraduate Award.
REFERENCES
1. N.R. Green and J. Campbell, Statistical Distributions of Fracture Strengths of Cast Al-7Si- Mg Alloy, Mat. Sci. Eng. A, 173 (1-2) (1993), pp. 261–266.
2. J.F. Major, Porosity Control and Fatigue Behavior in A356-T61 Aluminum Alloy, Trans. Amer. Foundrymens Soc., 105 (1998), pp. 901–906.
3. J.Z. Yi et al., Scatter in Fatigue Life Due to Effects of Porosity in Cast A356-T6 Aluminum-Silicon Alloys, Met. Mat. Trans. A, 34A (9) (2003), pp. 1879–1890.
4. E.J. Whittenberger and F.N. Rhines, Origin of Porosity in Castings of Magnesium-Aluminum and Other Alloys, J. Met., 4 (1952). pp. 409–420.
5. P.D. Lee, A. Chirazi, and D. See, Modeling Microporosity in Aluminum-Silicon Alloys: A Review, J. Light Met., 1 (1) (2000), pp. 15‐30.
6. D.M. Stefanescu, Computer Simulation of Shrinkage Related Defects in Metal Castings—A Review, Int. J. Cast Met. Res., 18 (2005), pp. 129–143.
7. P.D. Lee and J.D. Hunt, Hydrogen Porosity in Directional Solidified Aluminium-Copper Alloys: In situ Observation, Acta Mat., 45 (10) (1997), pp. 4155–4169.
8. J. Forsten and H.M. Miekk-oja, Radiographic Observations of the Solidification of Metals, J. Inst. Met., 95 (1967), pp. 143–145.
9. E.W.J. Miller and J. Beech, In-Situ Radiographic Observations of Alloy Solidification, Metallography, 5 (3) (1972), pp. 298–300.
10. M.P. Stephenson and J. Beech, "In Situ Radiographic Observations of Solute Redistribution During Solidification," Proc. Int. Conf. on Solidification and Casting of Metals, ed. J.D. Hunt (London, UK: Metals Society, 1979), pp. 34-38.
11. J.D. Hunt, K.A. Jackson, and H. Brown, Temperature Gradient Microscope Stage Suitable for Freezing Materials with Melting Points between –100 and +200°C, Review Sci. Instrum., 37 (6) (1966), pp. 805.
12. P.D. Lee and J.D. Hunt, A Model of the Interaction of Porosity and the Developing Microstructure, Modeling of Casting, Welding and Advanced Solidification Processes VII, ed. Mark Cross and John Campbell (Warrendale, PA: TMS, 1995), pp. 585–592.
13. R.H. Mathiesen and L. Arnberg, X-ray Radiography Observations of Columnar Dendritic Growth and Constitutional Undercooling in an Al-30 wt.%Cu Alloy, Acta Mater., 53 (2004), pp. 947–956.
14. R.H. Mathiesen and L. Arnberg, Stray Crystal Formation in Al-20 wt.%Cu Studied by Synchrotron X-ray Video Microscopy, Mater. Sci. Eng. A, 413-414 (2005), pp. 283–287.
15. O. Ludwig et al., In-situ Three-Dimensional Microstructure Investigation of Solidification of an Al-Cu Alloy by Ultrafast X-Ray Microtomography, Met. Mat. Trans. A, 36A (2005), pp. 1515–1523.
16. P.D. Lee and J.D. Hunt, Hydrogen Porosity in Directionally Solidified Aluminium-Copper Alloys. A Mathematical Model, Acta Mat., 49 (8) (2001), pp. 1383–1398.
17. J.D. Hunt and S.Z. Lu, Numerical Modeling of Cellular/Dendritic Array Growth: Spacing and Structure Predictions, Met. Mat. Trans. A, 27A (3) (1996), pp. 611–623.
18. W. Wang, P.D. Lee, and M. McLean, A Model of Solidification Microstructures in Nickel-Based Superalloys: Predicting Primary Dendrite Spacing Selection, Acta Mat., 51 (10) (2003), pp. 2971–2987.
19. R.C. Atwood and P.D. Lee, Simulation of the Three-Dimensional Morphology of Solidification Porosity in an Aluminium-Silicon Alloy, Acta Mat., 51 (18) (2003), pp. 54475466.
20. S.G.R. Brown, T. Williams, and J.A. Spittle, A Cellular Automation Model of the Steady-State Free Growth of a Non-isothermal Dendrite, Acta Metall. Mater., 42 (8) (1994), pp. 2893–2898.
21. J.A. Spittle and S.G.R. Brown, 3D Cellular-Automaton Model of Coupled Growth in 2-Component Systems, Acta Met., 42 (6) (1994), pp. 1811–1815.
22. C.A. Gandin and M. Rappaz, A 3D Cellular Automaton Algorithm for the Prediction of Dendritic Grain Growth, Acta Mat., 45 (5) (1997), pp. 2187–2195.
23. M. Rappaz and C.-A. Gandin, Probabilistic Modelling of Microstructure Formation in Solidification Processes, Acta Met. et Mat., 41 (2) (1993), pp. 345–360.
24. P.D. Lee and J.D. Hunt, Measuring the Nucleation of Hydrogen Porosity during the Solidification of Aluminium-Copper Alloys, Scripta Mat., 36 (4) (1997), pp. 399–404.
25. D.R. Poirier, K. Yeum, and A.L. Maples, A Thermodynamic Prediction for Microporosity Formation in Aluminum-Rich Al-Cu Alloys, Metall. Trans. A, 18A (11) (1987), pp. 1979–1987.
Peter D. Lee, Junsheng Wang, and Robert C. Atwood are with the Department of Materials at Imperial College London.
For more information, contact Peter D. Lee, Imperial College London, Department of Materials, Prince Consort Road, SW7 2AZ, U.K.; +44 207 594 6801; e-mail p.d.lee@imperial.ac.uk.
|
 Presenting a Web-Enhanced