Presenting a Web-Enhanced Presenting a Web-Enhanced Feature Article from JOM |
 LATEST ISSUE |
|||
TMS QUICK LINKS: |
• TECHNICAL QUESTIONS • NEWS ROOM • ABOUT TMS • SITE MAP • CONTACT US |
JOM QUICK LINKS: |
• COVER GALLERY • CLASSIFIED ADS • SUBJECT INDEXES • AUTHORS KIT • ADVERTISE |
|
| Research Summary: JOM-e: Visualization: Defects in Casting Processes | Online Only |
The Design Modification and Optimization
of an Ingot Casting Wheel Using SPH
Mahesh Prakash, Paul W. Cleary, John Grandfield, Patrick Rohan, and Vu Nguyen
| |||||||||||||||||||||||||||||||||||||||||||||
| |||||||||||||||||||||||||||||||||||||||||||||
| |||||||||||||||||||||||||||||||||||||||||||||
|
|
|||||||||||||||||||||||||||||||||||||||||||||
Questions? Contact jom@tms.org. © 2006 The Minerals, Metals & Materials Society |
|||||||||||||||||||||||||||||||||||||||||||||


|
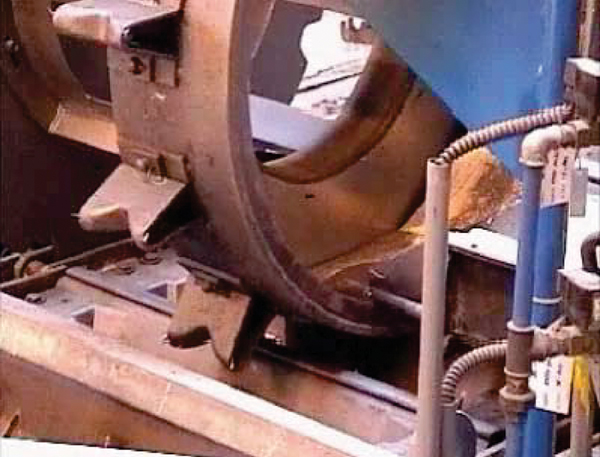
INTRODUCTION Aluminum re-melt ingot casting involves the pouring of molten aluminum from a launder into a rotating wheel containing several outlet spouts. As the wheel turns, the liquid flows from the outlet spouts into the ingots passing under the wheel (Figure 1). The overall quality and surface finish of the ingots depends on the amount of oxide generated during this pouring process. Experiments to determine the location and amount of oxide generated during the pouring process are difficult and costly to perform. Smoothed-particle hydrodynamics (SPH), due to its Lagrangian nature, is well suited to simulating the complex free surface flow, such as found in ingot casting, as well as the rotation of the wheel and the translation of the ingot molds. These advantages have also led to its use in modeling other applications such as high-pressure die casting,1 geophysical fluid flows,2 and stirred systems.3 It also has strong advantages in making direct predictions of oxide generation and transport, allowing estimates to be made of interior and exterior oxide content in each ingot manufactured. SPH MODELING Smoothed-particle hydrodynamics is a relatively new method for modeling coupled fluid flows, solid structures, and heat transfer with some unique capabilities. This method is particle-based rather than using conventional fixed grids or meshes to track the fluid and calculate the fluid velocities. The fluid is represented as blobs that move around in response to the fluid or solid stresses produced by the interaction with other particles. Smoothed-particle hydrodynamics is particularly well suited to momentum-dominated flows, flows involving complex free surface behavior, and flows with complex physics such as solidification or flow through industrial porous media. It is also useful for flows around moving objects, since there are no mesh structures to be affected. Using SPH interpolation formulae as introduced in References 46 and suitable finite difference approximations for second-order derivatives, one is able to convert parabolic partial differential equations into ordinary differential equations for the motion of the particles and the rates of change of their properties as given below.
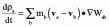
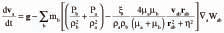
Continuity Equation The SPH momentum equation used here is Equation 2, where Ρa and μa are pressure and viscosity of particle a and vab = va vb. Here ξ is a factor associated with the viscous term,6 η is a small parameter used to smooth out the singularity at rab = 0, and g is the gravity vector. The first two terms involving the pressure correspond to the pressure gradient term of the Navier-Stokes equation. The next term involving viscosities is the Newtonian viscous stress term. This form ensures that stress is automatically continuous across material interfaces and allows the viscosity to be variable or discontinuous. Equation of State Since the SPH method used here is quasi-compressible one needs to use an equation of state, giving the relationship between particle density and fluid pressure. This relationship is given by the Equation 3, where P0 is the magnitude of the pressure and ρo is the reference density. For water and liquid metals, γ=7 is used. This pressure is then used in the SPH momentum equation (Equation 2) to give the particle motion. The pressure scale factor PO is given by Equation 4, where V is the characteristic or maximum fluid velocity. This ensures that the density variation is less than 1% and the flow can be regarded as incompressible. Oxide Modeling Aluminum oxide grows on the surface of molten aluminum as it cools down due to exposure to air. This oxide layer can be broken by flow of liquid metal creating new surface. The surface may be folded over on itself, entraining the oxide films. Thus, one could have interior and exterior oxide in an ingot mold and the extent of this oxide will depend on the flow characteristics. In order to quantify this oxide formation, a linear oxide (Ox) growth model7 was used (see Equation 5), where k1 is the rate constant and t time. The authors estimated the rate constant to be as shown in Equation 6. The units of k1 depend on the method used to follow the reaction.8 Where oxide-scale thickness is measured, as in Equation 5, then k1 has the units m/s, and if mass-gain measurement were to be used then the appropriate linear rate constant would have units of kg/m2s. In this case, the greater interest is in the amount of oxide formed. Therefore, the value of 10.9 × 10³ kg/m2s is used as the rate constant for oxide predictions. Note that a key advantage of SPH is that the transportation of oxide occurs automatically because of the Lagrangian nature of the method. This significantly simplifies the oxide-prediction process. PRELIMINARY DESIGN OPTIMIZATION In the preliminary design optimization stage, seven progressively more refined wheel and nozzle designs9 for casting aluminum ingots were evaluated for the amount of oxide generated in the ingot using SPH simulation of the flow in the ingot wheel setup. The flow of fluid from the launder through the wheel and into the molds for the original wheel design is shown in Figure 2 and Animation 1. The fluid is colored by velocity. In the first frame the fluid has reached the wheel starting from the feed launder. The second frame shows the formation of a pool of fluid in the wheel. This pool was originally intended to reduce fragmentation and break-up of the fluid as it flows through the spouts of the wheel and into the ingot molds. However the free surface of the pool is still quite dynamic and can lead to new surface being exposed to air. In frames three and four, the fluid has started filling the ingot molds after passing through the spouts. The spouts themselves are covered only on the sides. The spout is significantly exposed even when the mold is almost half full with fluid. This can lead to more metal being exposed to the air for oxidation. In the molds, one can see an indentation in the region where the fluid hits the molds when flowing from the spouts. There is a wave-like pattern in the fluid flow and causes the liquid metal to fill the mold starting from both ends. Thus, three potential causes of oxide formation due to the wheel design were identified here:
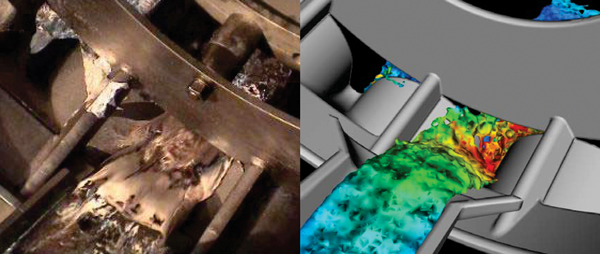
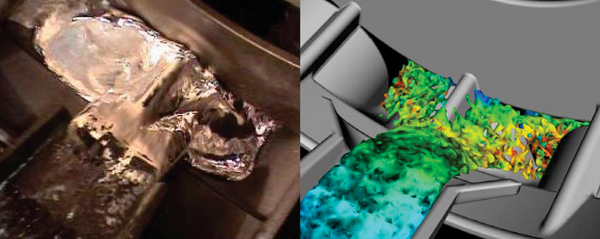
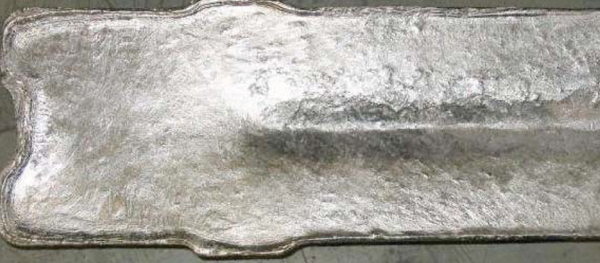
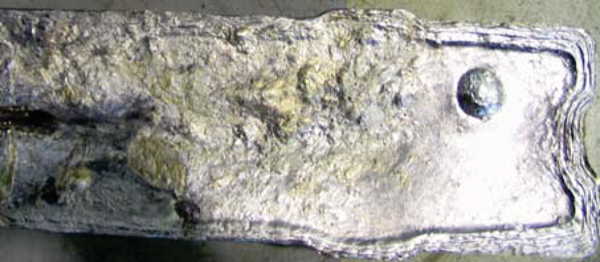
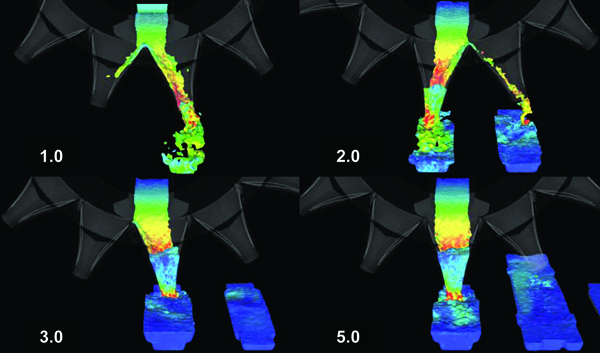
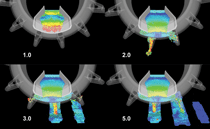
Such observations guided design evolution through seven stages based on the SPH simulated flow pattern and oxide predictions. The best design developed through this simulation process was used as the basis for the experimental testing with a full-scale pilot caster. The initial experiments10 still did not initially lead to high enough quality ingots. When the spout opening is directly opposite the launder the flow looks reasonable as in Figure 3a. However, when the flow impacts with the ribbed area between the spouts it fans out creating two flat streams entering the mold and also hits the back wall of the wheel (Figure 3b). This area was much more rounded in the original SPH simulations (frames on the right in Figure 3) showing less fanning of the fluid and thus less surface area exposed for oxidation than in the laboratory wheel. Since the experimental wheel could not be fabricated with such rounding on the top edge of the ribs between spouts, this created a flow pattern with attributes that led to significantly more exposed surface area for oxidation than was the case for the simulated wheel geometry. To correct the wheel design problem, the test wheel was further modified and the flat area between the spouts was eliminated. Some additional features (such as raised ridges in the spout in the flow direction) were added to reduce fluid surface area and resistance without causing splashing. Another important modification resulting from the laboratory test was the change in location of the discharge opening of the spouts from the front surface (directing flow along the mold) to the bottom of the spout (directing the flow down into the base of the mold). This optimized design was then tested on the full-scale pilot caster. The experiments were successful and led to very good quality ingots. Figure 4 compares the ingots produced from the preliminary and final stage design optimizations. The final optimized ingot (Figure 4a) has a very smooth surface finish throughout, while the ingot from the preliminary design optimization (Figure 4b) has poor top surface quality indicative of high oxide levels. Figure 5 and Animation 2 show the flow of fluid through the final optimized wheel. The flow rate was controlled at 30 t/h. The fluid is colored by its velocity with red being maximum and blue being minimum. Animation 3 shows the metal with the same view colored by oxide fraction with blue indicating low and red indicating a high oxide fraction. The fluid flows through the wheel and into the spout, and maintains good contact with the spout walls throughout the flow with very little splashing of the fluid. This minimizes the area of fluid in contact with air and reduces oxide generation. In the first frame at 1.0 s, the fluid has started flowing from the spout into the first ingot. The fluid in the spout is very dynamic in this early filling stage as seen by the regions colored red. A strong vortical flow pattern is observed within the spout as the fluid enters asymmetrically from one side and swirls rapidly around and then down and out into the ingot mold. This swirling pattern develops during the earlier stages of filling of the spout and also later when the fluid is substantially emptied from the spout. Due to the absence of the pool of fluid in the wheel (compare the first frame in Figure 2 to the one in Figure 5) the fluid starts filling up the molds much earlier for this wheel. By 2.0 s, the first spout is almost empty with all the fluid flowing into the first ingot mold. The fluid again shows a vortical pattern as it enters the second spout with a high-speed region close to the location where the fluid enters the mold. This vortical fluid flow pattern is seen clearly in Animation 4. The spouts are placed asymmetrically in the molds close to the far end (in the view shown in this figure). This causes the fluid to fill most of the mold in an essentially front-filling pattern which reduces the overall amount of exposure to air and minimizes splashing against the far end wall of the mold. The section behind the spout (see frame 3 at 3.0 s) is, however, filled by the secondary wave of fluid that emerges from the front-filled region. At 3.0 s the fluid in the spout is fairly quiescent and the swirl has damped out, as seen by the blue fluid color in the almost full spout. At this stage the spout is essentially vertical and almost the entire fluid is channeled into this one spout. Table I shows a comparison between the oxide content for the final optimized wheel design, the previous two best cases from the preliminary stage optimization process and the original wheel design. All values in the table are for the third mold when the flow pattern has stabilized. The new wheel design produces about 12% less oxide than the previous best case. Most significantly, this new wheel design produces about 53% less oxide than the original wheel design. Note that the reduction in oxide content has been achieved despite a 50% increase in the metal flow rate from the standard 20 t/h rate used in the industry. This project was conducted by the Cooperative Research Centre for Cast Metals Manufacturing (CAST). The support of ODT Engineering is gratefully acknowledged. Commonwealth Scientific and Industrial Research Organisation and ODT Engineering are core participants in CAST, which was established under and is supported in part by the Australian Government's Cooperative Research Centers scheme. 1. P.W. Cleary and J. Ha, Three-Dimensional SPH Simulation of Light Metal Components, J. Light Metals, 2/3 (1993), pp. 169183. Mahesh Prakash and Paul W. Cleary are with Commonwealth Scientific and Industrial Research Organisation (CSIRO) Mathematical and Information Sciences in Victoria, Australia. John Grandfield, Patrick Rohan, and Vu Nguyen are with CSIRO Manufacturing and Infrastructure Technology in Victoria, Australia. All are with Cooperative Research Centre for Cast Metals Manufacturing.
|
||||||||||||||||