 Presenting a Web-Enhanced Presenting a Web-Enhanced Feature Article from JOM |
 LATEST ISSUE |
|||
TMS QUICK LINKS: |
• TECHNICAL QUESTIONS • NEWS ROOM • ABOUT TMS • SITE MAP • CONTACT US |
JOM QUICK LINKS: |
• COVER GALLERY • CLASSIFIED ADS • SUBJECT INDEXES • AUTHORS KIT • ADVERTISE |
|
| Overview: JOM-e: Visualization: Defects in Casting Processes | Online Only |
Transient Fluid-Flow Phenomena in the
Continuous Steel-Slab Casting Mold and Defect Formation
Brian G. Thomas, Quan Yuan, Bin Zhao, and S. Pratap Vanka
| ||||||||||||||||||||||||||||||||||||||||||||||||
| ||||||||||||||||||||||||||||||||||||||||||||||||
| ||||||||||||||||||||||||||||||||||||||||||||||||
|
||||||||||||||||||||||||||||||||||||||||||||||||
Questions? Contact jom@tms.org. © 2006 The Minerals, Metals & Materials Society |

|
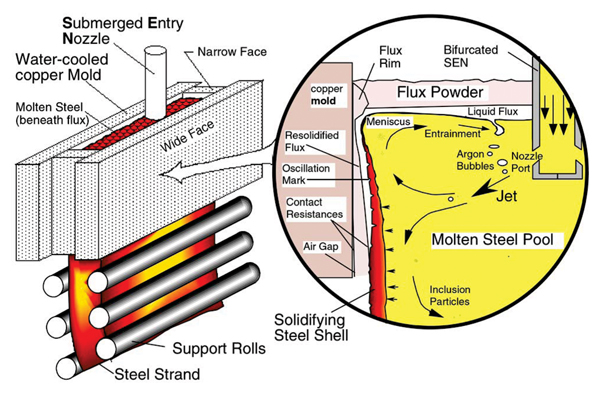
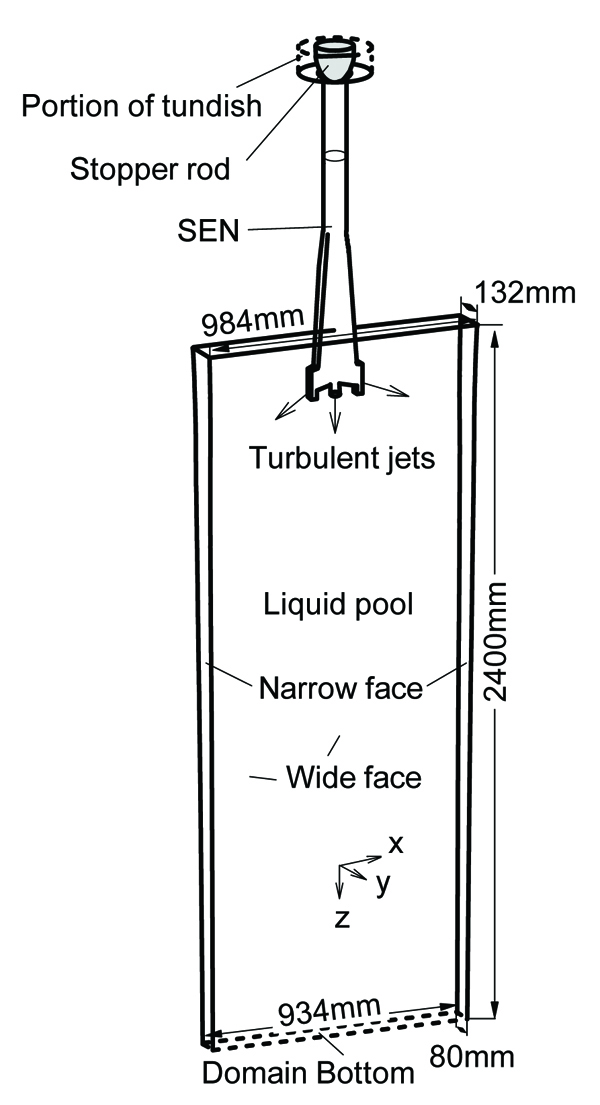
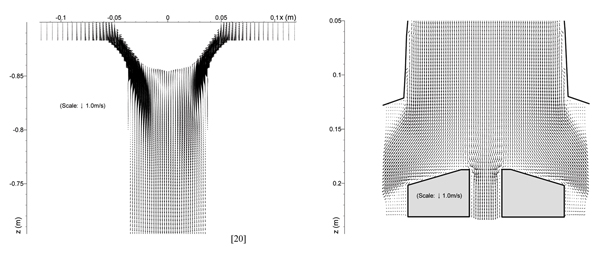
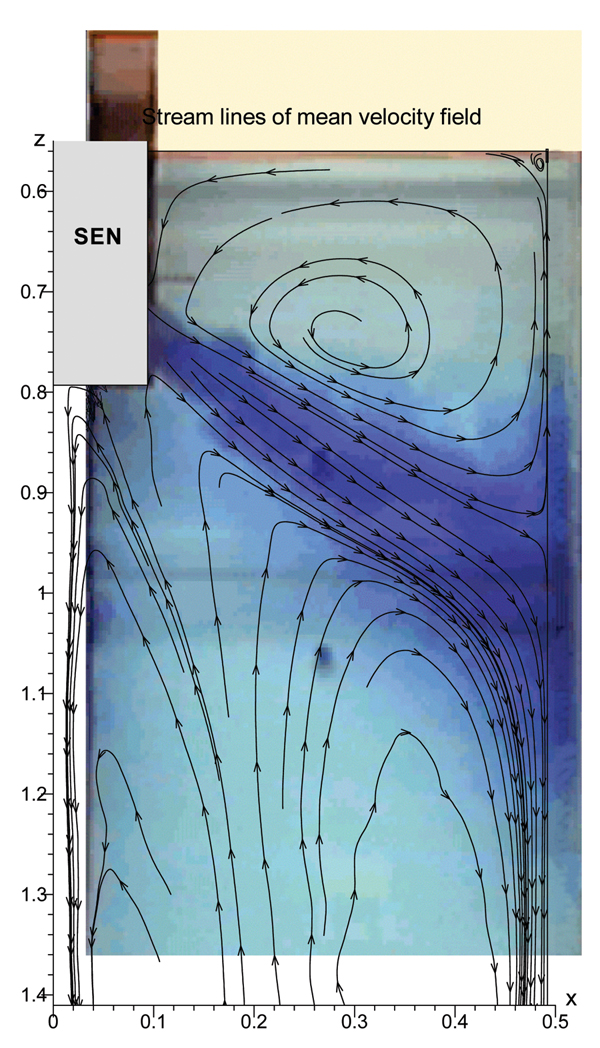
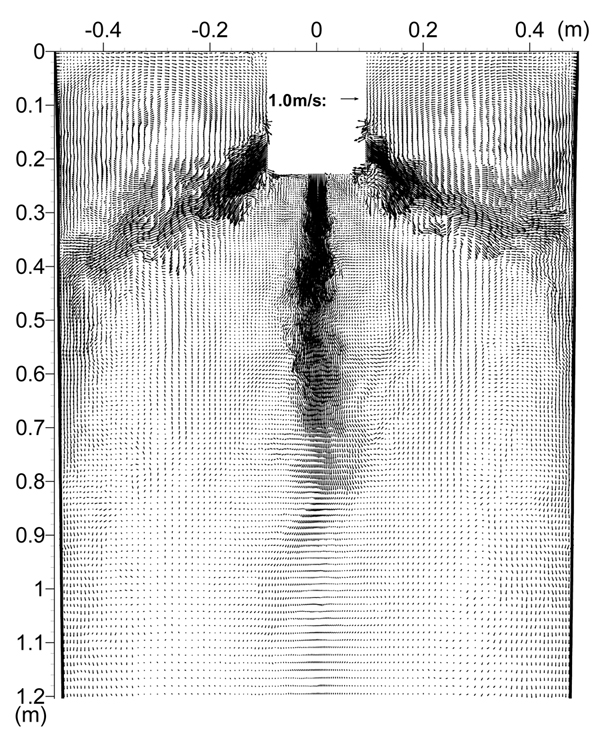
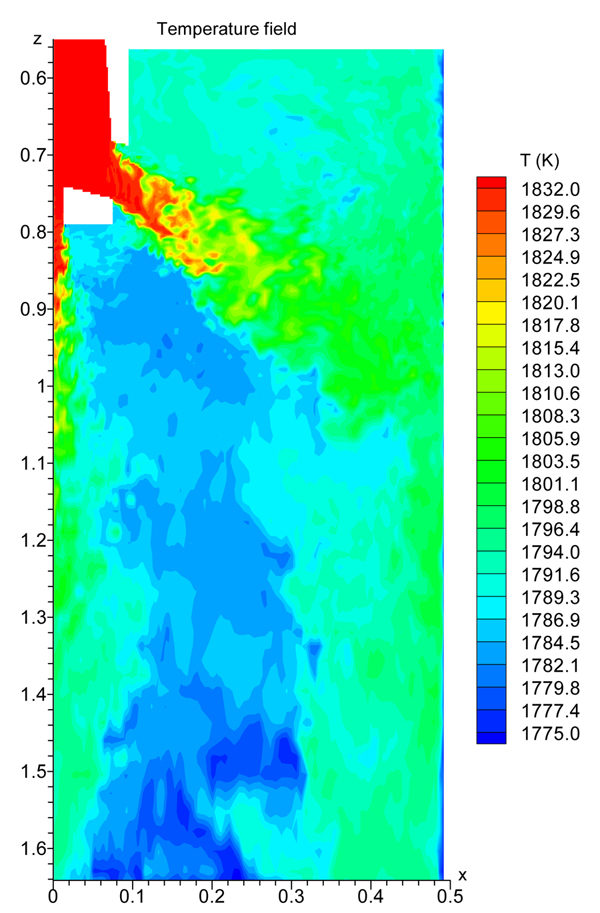
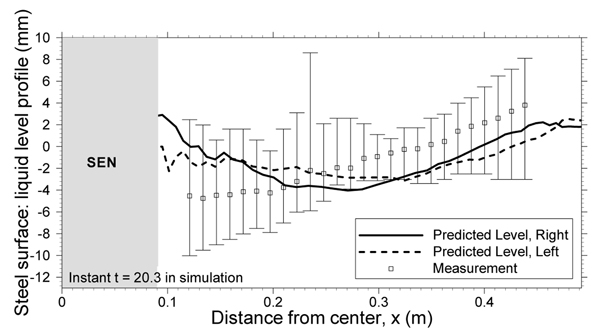
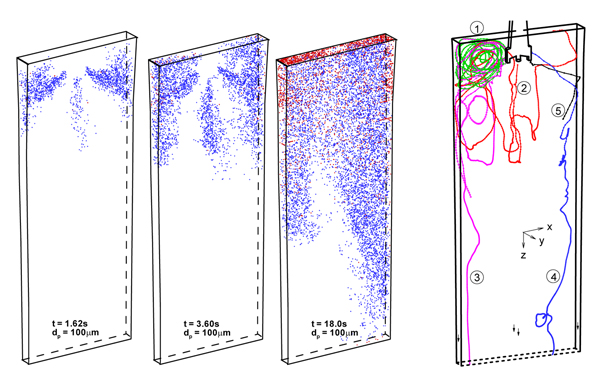
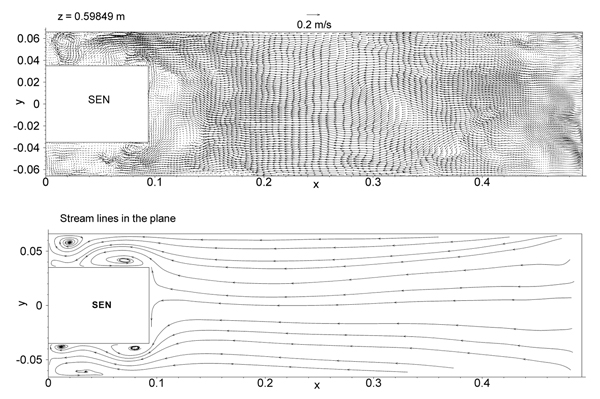
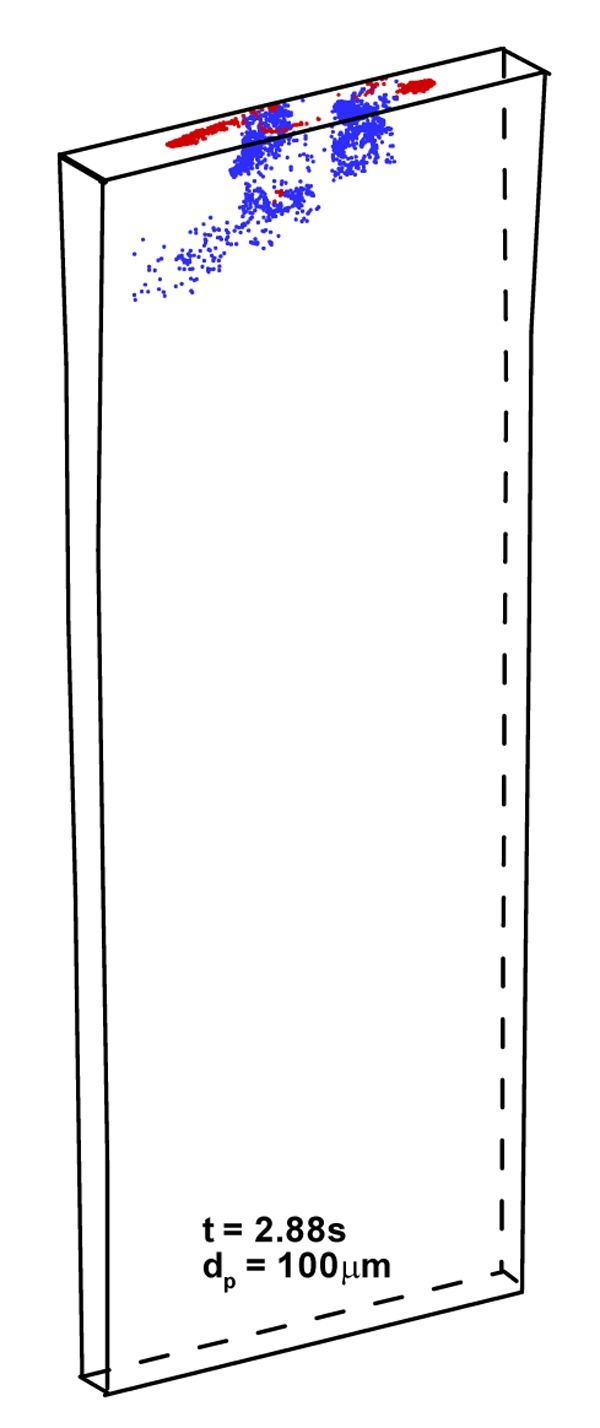
INTRODUCTION The quality of continuous-cast steel is greatly influenced by fluid flow in the mold, particularly at the meniscus. Significant previous research has investigated this using plant experiments,1 water models,2 and computational models,3–7 which is beyond the scope of this work to review. Animations of the transient flow pattern were presented previously.8 The current work focuses on animations of the accompanying phenomena that lead to defects. Some of the flow phenomena involved in slab casting are illustrated in Figure 1a.9 Flow enters the mold through a submerged entry nozzle (SEN), which is partly constricted by a slide gate, or stopper rod that is used to control the flow rate. The complex geometry of the nozzle ports can direct the steel jets into the mold cavity at a range of angles, turbulence levels, and swirl components. Inside the mold cavity, the flow circulates within the liquid pool contained within the curved sides of the walls of the solidifying dendrites. The steel jets traverse the liquid pool to impinge against the narrow faces, splitting into two flows along the narrow face for a typical double-roll flow pattern. Upward flow transports superheat and momentum to the top surface and circulates back toward the SEN. If this flow is too slow or too cold, the meniscus can freeze to form subsurface hooks and deep oscillation marks, leading to surface defects. On the other hand, excessive velocity and turbulence of this flow can cause surface-level fluctuations that disturb meniscus solidification, entrain inclusions and bubbles, and lead to surface defects. The flow also transports inclusion particles, which can be safely removed into the mold slag or can be entrained as defects into the solidifying steel shell. These particles often enter through the nozzle from upstream, including deoxidation products, exogenous inclusions, and gas bubbles. In addition, the surface flow may emulsify the slag, entraining slag particles into the steel, creating another source of inclusion defects in the final product.10 The flow pattern is controlled by the nozzle and mold geometry, casting speed, and sometimes also by electromagnetic forces, or the buoyancy force from introduced gas bubbles. It varies greatly with time, even for nominally steady casting conditions. Understanding the flow pattern is a difficult and important step, but the flow pattern itself is not of direct concern to steel quality. Further computations of associated phenomena such as superheat transport, top-surface-level fluctuations, and the movement and entrapment of inclusion particles yield more practical insights into defect formation.6 This work illustrates turbulent fluid flow and related phenomena leading to defect formation in continuous casting, based on animations of computational model simulations of these phenomena at the University of Illinois for a typical continuous-caster configuration. LARGE-EDDY SIMULATIONS Flow-related defects are investigated in this work using large-eddy simulations (LES) of a typical stopper-rod controlled, 132-mm-thick steel slab caster, for the geometry in Figure 1b and detailed conditions given in Table I.11 This configuration was chosen because many experimental and plant measurements were available for model validation.1114 Further details on these simulations are given elsewhere.11,13,15,16 The simulations of turbulent fluid flow in this work are achieved by computational brute force: solving the three-dimensional Navier Stokes equations on a fine grid of over 1.5 million nodes with time steps of 0.001 s. The simulations were performed with an in-house code, UIFLOW, which uses the Harlow-Welch fractional step discretization on a staggered grid, second-order central differencing for the convection terms, the Adams-Bashforth scheme for time discretization, and the Crank-Nicolson scheme for the diffusion terms.11 The minor effects of turbulence from the sub-grid scale eddies were modeled with the standard Smagorinsky model. Even with an efficient algebraic multigrid solver to handle the complex, unstructured geometry, the simulations are quite slow and took 29.5 central-processing-unit seconds per time step on a Pentium IV 1.7 GHz personal computer for the 1.3 million cells grid or 24 days for 70,000 time steps (70 s of real time). The first simulations employed separate model domains of the entire nozzle and upper strand. The 1.1-m-long nozzle domain of 0.6 million cells included the bottom portion of the tundish, the stopper rod, and the nozzle ports. Velocities at the outlet planes were input to a 1.3 million cell domain of the top 2.4 m of the liquid pool region in the mold and upper portion of the 984-mm-wide strand. The strand domain included only the liquid steel, and so was tapered to match the shape of the liquid cavity, which was known from breakout shell measurements and solidification models.17 Special boundary conditions at the solidification front employed mass and momentum sink terms to account for the material leaving the domain due to solidification.11 Surface level was estimated from the pressure variations computed along the rigid top boundary.11 To obtain the finest possible mesh for the simulations with superheat transport, a single domain with 1.6 million cells was used, which included only the bottom 687 mm length of the nozzle, and one half of the mold width (492 mm wide × 1.2 mm long mold domain). The transient-heat-conduction equation was solved, basing the dominant advection terms on the velocity solution. The sub-grid-scale static K model was used to resolve the small-scale eddies, as described elsewhere.13 Particles were simulated in a Monte-Carlo manner, by injecting several groups of 10,000 particles each into the nozzle and integrating the particle transport equation for the trajectory of each particle through the transient velocity field.15 Particles touching the top surface were removed into the slag layer. Particles touching a solidification front were entrapped as inclusion defects if they were smaller than the primary dendrite arm spacing. Larger particles were subjected to an instantaneous force balance to determine if drag from the transverse flowing liquid is sufficient to overcome the entrapment forces. Details of this entrapment criterion are described elsewhere.18,19 These model computations have undergone extensive validation, through grid refinement studies,20 comparison with water model measurements11 including particle image velocimetry,21,22 and measurements in operating steel casters.11,13,22,23 Traditional K-ε models produce similar agreement for the time average flow pattern.22 Details of these quantitative comparisons are documented in previous publications.11,13,2023 The chaotic flow continues into the mold region, where variations between sides persist and grow. The streamlines in Figure 3 compare the predicted time-averaged flow pattern in half of the mold with a photograph of die injection in a full-scale water model of the process.13 Animation 3 shows the transient flow pattern in the water model, visualized using die injection. Animation 4 shows the corresponding LES computation, in the full-mold domain. A typical snapshot of this flow pattern is given in Figure 4.11 In both cases, the jets exhibit asymmetry between sides which fluctuate over time, but the flow patterns roughly match. The upper and lower roll structures each evolve chaotically between a single large recirculation structure and a complex set of evolving smaller structures and vortices. Fast- and slow-moving flow structures alternate chaotically along the top surface, sometimes producing time periods with velocity much greater than the mean. Computing the flow pattern is the first step in predicting the phenomena related to defects discussed in the next sections. Impingement of the molten steel jets onto the solidifying shell in the mold can cause problems if the jet is either too hot or too cold. A jet with excessive superheat can cause the solidifying shell to melt at the impingement point near the narrow face corners, leading to a breakout if thinning persists past the mold exit.2325 However, a jet with insufficient superheat can deliver steel to the top surface that is too cold, which leads to surface skulling, freezing of the meniscus, and related surface defects. Figure 5 shows a typical snapshot of the temperature distribution in this caster.13 The superheat drops as the steel moves from 57°C at the outlet ports (red) to only a few degrees at the coldest locations found at the meniscus (perimeter of the top surface), especially near the SEN and the narrow face and corners. Temperature measurements down the middle of the upper recirculation region match the local predictions of ~17°C superheat.13 Animation 5 illustrates the evolution of the flow vectors in half of the mold (left) and the corresponding temperature distribution (right), which varies with time and position according to the transport of superheat within the liquid steel. Very cold (blue) regions appear intermittently near the narrow face meniscus (top right corner). Supercooling of the liquid in this manner tends to freeze the meniscus, initiating deep subsurface hooks and deep oscillation marks in this location.26 The transient cold eddies revealed in this animation explain why hook depth varies with position both along and down the cast strand. Controlled oscillation of the mold generates ripples across the liquid level, but does not present an inherent quality problem because the liquid near the mold wall tends to move with the wall. Large, sudden jumps or dips in liquid level are much more serious, however. Variations in the top surface liquid level caused by momentum variations in the turbulent flowing liquid were computed from the velocity simulation results. Inclusions exiting the submerged nozzle may either float to the top surface and become entrained harmlessly into the slag layer or may be trapped in the solidifying front, leading to defects such as internal cracks and slivers in the final rolled product. Determining where these inclusions finally end up is thus quite important to quality. Figure 7a shows snapshots taken at three times from the 100-second video, Animation 7 of the trajectories of 10,000 100-μm inclusion particles injected into the caster.15 Red indicates the final entrapped or refloated location of the particle, and blue indicates particles that are still moving. Particles exiting the bottom of the domain are entrapped lower in the caster. Note the strong asymmetric flow, as chaotic flow variations send stronger flow down one side of the caster, carrying more particles deeper into the caster than the time-averaged flow pattern would suggest. Figure 7b shows the trajectories of five typical inclusion particles, which represent the range of fates experienced by the particles:15
Tabulating the particle statistics reveals that only ~8% of the small particles entering the mold from the nozzle reach the top surface to be safely removed. Larger particles, such as the 100-μm inclusions animated here, are removed more easily owing to their greater buoyancy and ease of escaping capture by being washed from the solidification front. However, removal rates are still small: 13%, 42%, and 70% for 100 μm, 250 μm, and 400 μm particles, respectively. These predictions are consistent with measurements and suggest that inclusions should be removed during upstream processing, while the flow pattern in the mold should be controlled to optimize surface turbulence and temperature to avoid surface problems. Mold slag can be entrained into the solidifying shell due to vortexing, high velocity flow that shears slag from the surface, and turbulence at the meniscus. The capture of large inclusions into the solidifying shell then leads to obvious line defects or slivers in the final product. Mold slag defects arise in two stages: first, emulsifying the slag into droplets entrained in the steel and second, transporting the slag inclusions to become entrapped in the solidifying steel shell. Slag emulsification can arise through shearing off of slag fingers due to excessive surface velocity or by vortexing. Vortexing most often occurs during conditions of asymmetrical flow, where steel flows rapidly through the narrow passage between the SEN and the mold. Even without asymmetric flow between halves of the mold, flow past the SEN causes swirling regions to appear and disappear in the critical region between the SEN and shell, as shown in Animation 8 and Figure 8.13 This can lead to sliver formation and longitudinal cracks near the strand centerline. This swirling flow hastens erosion of the nozzle refractory walls. Visible erosion patterns at the locations near the off-corner and center of the wide thin-slab nozzle have been observed in practice, corresponding closely to the locations where swirl is observed in the animations. With more severe flow conditions, the swirls or vortex may draw mold slag downward, near the sides of the nozzle. This is most likely with higher surface velocities (>0.4m/s),27 or if there is asymmetric flow from one side to the other. In addition to the vortex, slag may also be drawn downward by the recirculation pattern that accompanies flow from the nozzle ports. Thus, slag entrainment is most likely with shallow nozzle submergence and high casting speed. The fate of these particles is illustrated in Figure 9 and Animation 9.18 Many of the slag particles quickly float back to the surface, (red, representing almost 50% in this example). If emulsified slag particles are drawn deep enough to become entrained with the jets exiting the nozzle ports, however, this animation illustrates how the slag particles are transported everywhere, (blue) creating inclusion defects wherever they are entrapped in the shell (red). This particle behavior is the same as that of particles entering through the nozzle ports. Mold slag entrainment is one of the most common preventable causes of serious defects in the cast product. Animations of fine-grid LES computations are applied to illustrate several phenomena associated with transient fluid flow, which are important to defect formation during the continuous casting of steel. The computations focus on a typical medium-thickness slab caster, with a stopper-controlled, three-port submerged entry nozzle, where extensive water model with plant measurements were available for model validation. The animations reveal important insights into the flow-related phenomena that lead to defect formation.
The insights generated through these animations foster better understanding of how defects form, and facilitate technologies to overcome them. The authors wish to thank the National Science Foundation (Grants DMI 01-15486 and DMI 04-23794) and the Continuous Casting Consortium at the University of Illinois at Urbania-Champaign (UIUC) for support of this research, FLUENT Inc., for providing the FLUENT code, and the National Center for Supercomputing Applications at UIUC for computing time. Additional thanks are extended to R. OMalley and AK Steel for the experimental measurements used in model validation. 2. P.H. Dauby, M.B. Assar, and G.D. Lawson, PIV and MFC Measurements in a Continuous Caster Mould. New Tools to Penetrate the Caster Black Box, La Revue de Metallurgie - CIT, 98 (4) (2001), pp. 353366. 3. B.G. Thomas, L.J. Mika and F.M. Najjar, Simulation of Fluid Flow Inside a Continuous Slab Casting Machine, Metall. Trans. B, 21B (2) (1990), pp. 387400. 4. B.G. Thomas, Chapter 14. Fluid Flow in the Mold, Making, Shaping and Treating of Steel: Continuous Casting, Vol. 5, ed. A. Cramb (Pittsburgh, PA: AISE Steel Foundation, 2003), pp. 14.114.41. 5. B.G. Thomas and L. Zhang, Review: Mathematical Modeling of Fluid Flow in Continuous Casting, ISIJ Internat., 41 (10) (2001), pp. 11811193. 6. B.G. Thomas, Modeling of Continuous-Casting Defects Related to Mold Fluid Flow, Iron and Steel Technology (AIST Transactions), 3 (7) (2006), pp. 128143. 7. B.G. Thomas, Chapter 5. Modeling of Continuous Casting, Making, Shaping and Treating of Steel: Continuous Casting, Vol. 5, ed. A. Cramb (Pittsburgh, PA: AISE Steel Foundation, 2003), pp. 5.15.24. 8. B.G. Thomas, Casting Process Simulation and Visualization: A JOM-e Perspective, JOM, 54 (1) (2002), pp. 2021. 9. B.G. Thomas and F.M. Najjar, Finite-Element Modeling of Turbulent Fluid Flow and Heat Transfer in Continuous Casting, Applied Mathematical Modeling, 15 (5) (1991), pp. 226243. 10. W.H. Emling et al., Subsurface Mold Slag Entrainment in Ultra-Low Carbon Steels, Steelmaking Conf. Proc., Vol. 77 (Warrendale, PA: ISS, 1994), pp. 371379. 11. Q. Yuan, B.G. Thomas, and S.P. Vanka, Study of Transient Flow and Particle Transport during Continuous Casting of Steel Slabs, Part 1. Fluid Flow, Metall. & Mater. Trans. B., 35B (4) (2004), pp. 685702. 12. B.G. Thomas, R.J. OMalley, and D. Stone, Measurement of Temperature, Solidification, and Microstructure in a Continuous Cast Thin Slab, Modeling of Casting, Welding, and Advanced Solidification Processes VIII, ed. B.G. Thomas and C. Beckermann (Warrendale, PA: TMS, 1998), pp. 11851199. 13. B. Zhao et al., Transient Fluid Flow and Superheat Transport in Continuous Casting of Steel Slabs, Metall. & Mater. Trans. B, 36B (6) (2005), pp. 801823. 14. Y. Meng and B.G. Thomas, Simulation of Microstructure and Behavior of Interfacial Mold Slag Layers in Continuous Casting of Steel, ISIJ International, 46 (5) (2006), pp. 660669. 15. Q. Yuan, B.G. Thomas, and S.P. Vanka, Study of Transient Flow and Particle Transport during Continuous Casting of Steel Slabs, Part 2. Particle Transport, Metal. & Material Trans. B, 35B (4) (2004), pp. 703714. 16. Q. Yuan et al., Study of Computational Issues in Simulation of Transient Flow in Continuous Casting, Materials Science & Technology 2004, Vol. II (Warrendale, PA: TMS, 2004), pp. 333343. 17. B.G. Thomas, R.J. OMalley, and D.T. Stone, Measurement of Temperature, Solidification, and Microstructure in a Continuous Cast Thin Slab, Modeling of Casting, Welding, and Advanced Solidification Processes, Vol. VIII, ed. B.G. Thomas and C. Beckermann (Warrendale, PA: TMS, 1998), pp. 11851199. 18. Q. Yuan and B.G. Thomas, Transport and Entrapment of Particles in Continuous Casting of Steel, 3rd Internat. Congress on Science & Technology of Steelmaking (Warrendale, PA: Association for Iron & Steel Technology, 2005), pp. 745762. 19. Q. Yuan, Transient Study of Turbulent Flow and Particle Transport During Continuous Casting of Steel Slabs (Ph.D. thesis, University of Illinois at Urbana-Champaign, IL, 2004). 20. Q. Yuan et al., Study of Computational Issues in Simulation of Transient Flow in Continuous Casting, Steel Research International, 76 (1, Special Issue: Simulation of Fluid Flow in Metallurgy) (2005), pp. 3343. 21. Q. Yuan et al., Computational and Experimental Study of Turbulent Flow in a 0.4-Scale Water Model of a Continuous Steel Caster, Metall. & Mater. Trans. B, 35B (5) (2004), pp. 967982. 22. B.G. Thomas et al., Comparison of Four Methods to Evaluate Fluid Velocities in a Continuous Casting Mold, ISIJ Internat., 41 (10) (2001), pp. 12661276. 23. B.G. Thomas et al., Validation of Fluid Flow and Solidification Simulation of a Continuous Thin Slab Caster, Modeling of Casting, Welding, and Advanced Solidification Processes, Vol. IX (Aachen, Germany: Shaker Verlag GmbH, 2000), pp. 769776. 24. G.D. Lawson et al., Prevention of Shell Thinning Breakouts Associated with Widening Width Changes, Steelmaking Conf. Proc., Vol. 77 (Warrendale, PA: ISS, 1994), pp. 329336. 25. B.G. Thomas, A. Moitra, and R. McDavid, Simulation of Longitudinal Off-Corner Depressions in Continuously-Cast Steel Slabs, ISS Transactions, 23 (4) (1996), pp. 5770. 26. J. Sengupta et al., Mechanism of Hook Formation during Continuous Casting of Ultra-low Carbon Steel Slabs, Metall. & Mater. Trans. A, 37A (5) (2006), pp. 15971611. 27. J. Kubota et al., Meniscus Flow Control in the Mold by Travelling Magnetic Field for High Speed Slab Caster, Mold Operation for Quality and Productivity, ed. A.W. Cramb and E. Szekeres (Warrendale, PA: Iron and Steel Society, 1991). B.G. Thomas, Q. Yuan, B. Zhao, and S.P. Vanka are with the Department of Mechanical Science & Engineering at the University of Illinois at Urbana-Champaign. |