|
While there are numerous contestants
in the race to produce low-cost solar
silicon, the chemistries involved can be
grouped into three categories: new Siemens-like processes, new approaches
to reduction of silica, and upgrades of
metallurgical-grade silicon. This review
is focused on the thermo-chemistries being
employed in the last two categories,
with emphasis on removal of boron and
phosphorous, as these elements are the
two most difficult to remove from silicon
by unidirectional solidification.
INTRODUCTION
Historically, the photovoltaic (PV)
industry relied on off-spec electronic-grade
silicon (e-Si) as its primary raw
material. That silicon, produced through
the Siemens Process, is both costly and
far purer (nine 9s) than that necessary
for PVs.1 With growing demand, it was
only a matter of time before there was
a shortage of silicon for PVs. The first
shortage occurred in 1996/97 with the
price of silicon rising to $75 per kg on
the spot market, three times the production
cost at that time.1 That shortage
quickly disappeared, only to reappear in
2003 with the spot market price rising
to $450 per kg in 2008.2 Since the recent
economic downturn, the spot market
price fell to $75 per kg by the end
of May.3 By the time this manuscript is
published the price will likely be $50
per kg or lower.2
While conditions that brought about
the latest shortage have eased, the insatiable
desire for energy and the political will of many countries to curb CO2 emissions
assures that demand for PVs will
continue to grow. There are only a few
PV materials with known reserves that
can contribute at the tera-Watt-year level
needed to meet the estimated shortfall
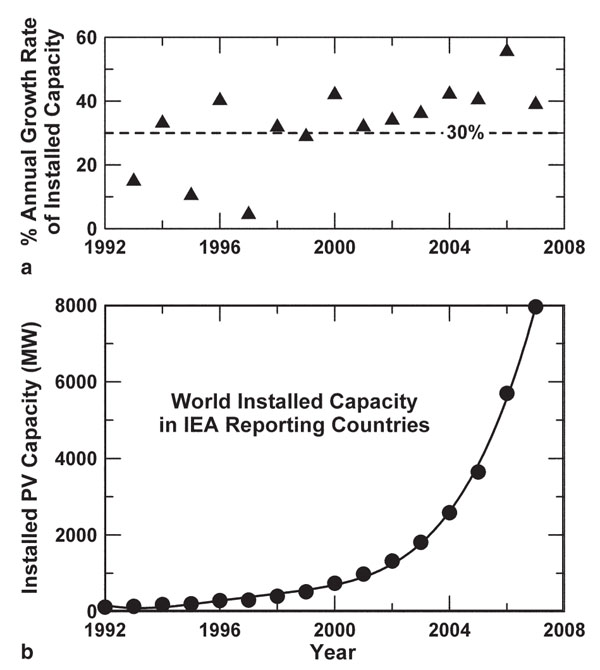
in electrical energy.4 Silicon dominates
90% of the PV market today. While that
percentage is expected to decline to 33%
by 2030,5 historic annual growth rates of
more than 30% for new installed PV capacity,
as shown in Figure 1, suggests a
growing future for silicon and other PV
materials. The phenomenal growth rate
has been due largely to the willingness
of a few countries to provide subsidies.
Undoubtedly, the annual growth rate for
2009 will be lower, reflecting the downturn
in the economy and reduction in
subsidies. However, the cost of silicon
is expected to again approach the production
cost for silicon produced in the
Siemens Process, now estimated to be
$3040 per kg.
| HOW WOULD YOU... |
…describe the overall significance
of this paper?
This paper provides a mix of
thermo-chemistry, thermodynamics,
and economics while reviewing
research and developments aimed
at capitalizing on the growth of the
photovoltaic industry. Much of the
manuscript is focused on the thermochemistry
of boron and phosphorus,
and the behavior of those elements
during reduction of silica and
refi ning of silicon. These are the two
most diffi cult elements to remove
from silicon and the two elements
that dictate success or failure in
producing low-cost solar silicon by
metallurgical means.
…describe this work to a
materials science and engineering
professional with no experience in
your technical specialty?
This article uses chemical
thermodynamics and physical
chemistry to evaluate literature
involving tramp elements in the
silicon submerged arc furnace,
and during the refi ning of silicon.
With respect to refi ning processes,
much of the focus is on boron
and phosphorus, and the thermochemical
behavior of those elements
during slagging, silicide formation,
recrystallization, and volatilization
by e-beam melting, plasma heating,
and chemical reaction.
…describe this work to a
layperson?
This article takes a broad view of the
thermo-chemistry being employed
to develop a process for producing
low-cost solar silicon. Historically,
the photovoltaic industry relied on
off-spec electronic-grade silicon
as its primary raw material. That
silicon is costly and far purer than
necessary for solar cells. Technical
advancements in other areas along
the value chain have left the raw
material cost of silicon as the single
largest contributor to the cost of
producing solar cells. |
Silicon-based PVs can play a far
greater role in meeting the worlds need
for electrical energy, given its plentiful
supply, but only if cost reductions
along the entire production chain can be
achieved. Silicon amounts to more than
25% of the cost of producing PV panels
made from polysilicon, and as much as
40% for single-crystal silicon systems.
The target cost in the race to produce 6-nines pure s-Si is $15 per kg.
Production and refining of silicon
for manufacture of PVs begins with the
silicon submerged arc furnace and ends
with unidirectional solidification (UDS).
The latter is essential for producing an
ingot for wire sawing, but it can also be
the last step in refining. What happens
to boron and phosphorous in the arc
furnace up to UDS in producing s-Si by
metallurgical means is the focus of this
manuscript.
Impurities in the
Silicon Submerged Arc
Furnace
An understanding of the presence of
impurities in silicon, particularly boron
and phosphorous, begins with examination
of the thermo-chemistry of the arc
furnace for which a partial cross section
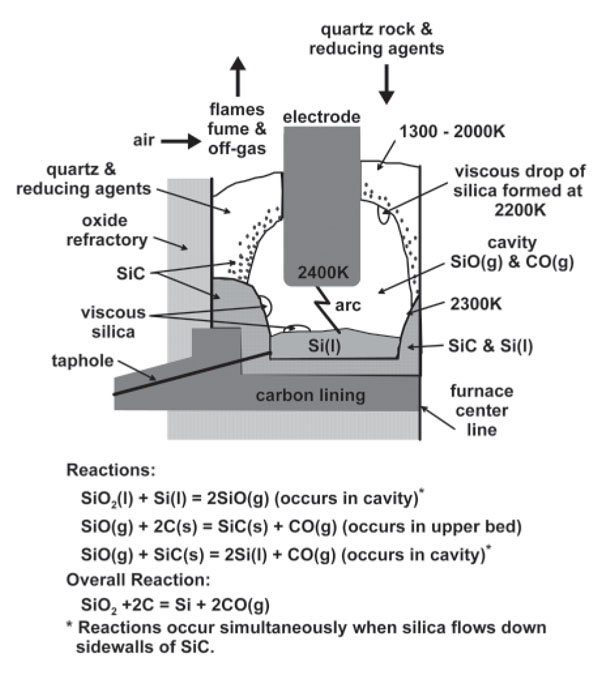
is presented in Figure 2. The kettle, containing
the silicon and charge, is rotated
once every 20 to 30 days, and results in
cavities forming around each electrode.
The cavities play a critical role in a
physico-chemical process in the production
of silicon. Cavity temperatures vary
from 2,200 K at the top to 2,400 K at the
bottom of the electrode.
At these temperatures kinetic processes
will be fast, and thermodynamic
equilibrium becomes the dominant factor
as to what takes place in the furnace.
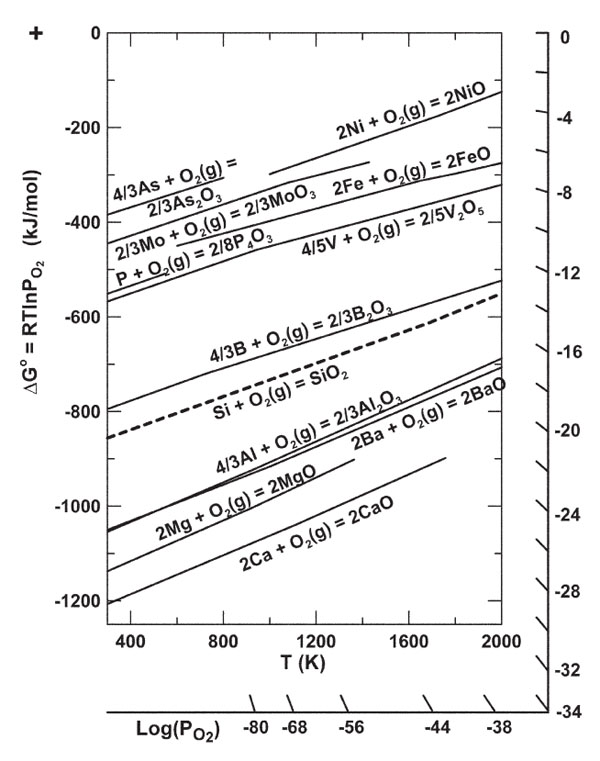
The Si/SiO2 equilibrium line in the Ellingham
diagram in Figure 3 delineates
oxides above the line that are reduced in
the furnace, and those below the line that
are partially reduced through dissolution
of the metal atom in molten silicon and
formation of SiO2 or SiO(g). The high
temperatures and the reducing conditions
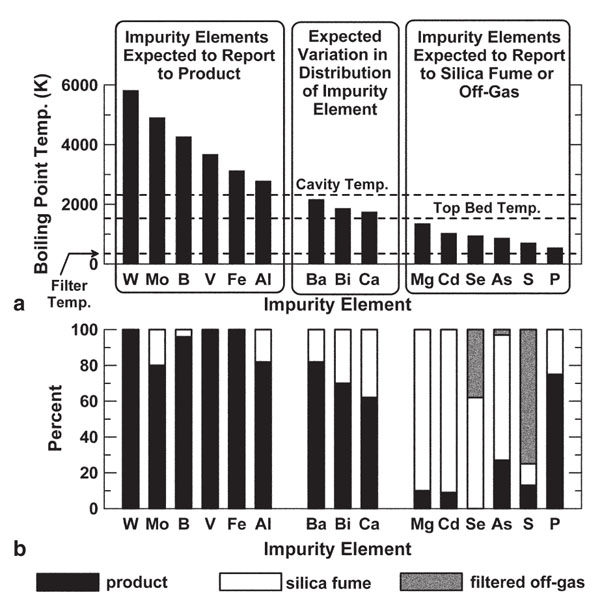
in the arc furnace led Myrhaug and
Tveit7 to develop a boiling point model
for 30 impurity elements, which they
tested by conducting mass balances.
Elements, such as boron, with a normal
boiling point temperature above the
highest temperature in the submerged
arc furnace were expected to leave the
furnace in the product, whereas elements
with boiling point temperatures
below that of the top bed temperature
in the furnace, like phosphorous, were
expected to leave the furnace in the flue
gas. Elements with temperatures in between
the two limits were expected to
distribute between the silicon, flue gas,
and silica fume. The results of the mass
balances presented in Figure 4 reveal
that industrial practice is in agreement
with the model, with the most serious
disagreement involving phosphorous.
The model predicts that all phosphorous
should be volatilized, whereas the mass
balance reveals that 75% of the phosphorous
left the furnace in the silicon.
The presence of both boron and phosphorous
in m-Si poses a serious problem
for companies seeking to produce s-Si
by metallurgical processes. While other
impurity elements readily respond to
purification by UDS, phosphorous responds
weakly and boron not at all.
Phosphorus in the Arc Furnace
Quartz, in ball size chunks of 58 cm
in diameter, charged to the arc furnace
contains apatite (Ca3(PO4)2) and iron oxides,
both sealed within the rock.7,8 As
quartz is heated, iron oxides fuse with
the silica, forming droplets of slag that
dissolves apatite. Only after the fused
and viscous silica enters the cavity in the
furnace and contacts molten silicon are
the small droplets of slag exposed to reducing
conditions, where the iron oxide
in the slag is reduced and the resulting
elemental iron reacts with the phosphorous
in the slag, forming an Fe-P alloy.9
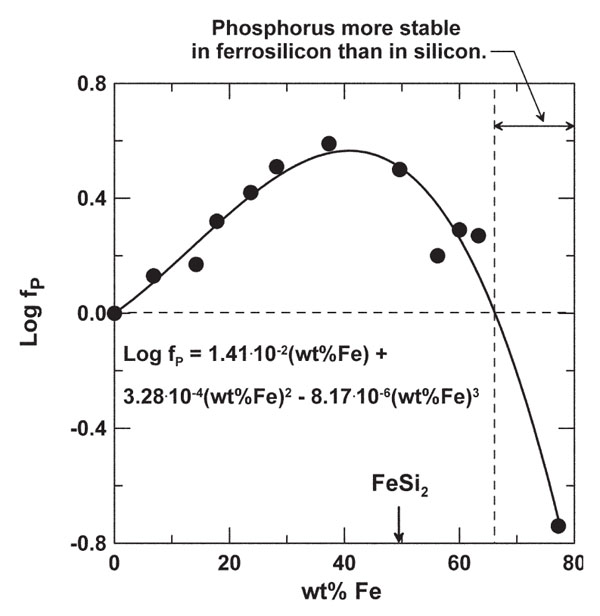
Phosphorous is far less volatile in molten
iron than silicon. Volatility of phosphorous
is linked directly to the activity
coefficient of phosphorous in the alloy,
fP, shown in Figure 5. The 1 wt.% standard
state values for fP are with respect
to the Si-P alloy, where fP has a value of
1. Negative values for log fP reflect less
volatility for phosphorous than that in
molten silicon, and positive values greater
volatility. Maximum volatility occurs
at a composition corresponding closely
with FeSi2, suggesting preferred bonding
between silicon and iron supplants
bonding between iron and phosphorous.
Only when the iron content in the Fe-Si
alloy exceeds 65 wt.% is the volatility of
phosphorous in solution below that of
phosphorous in molten silicon.10
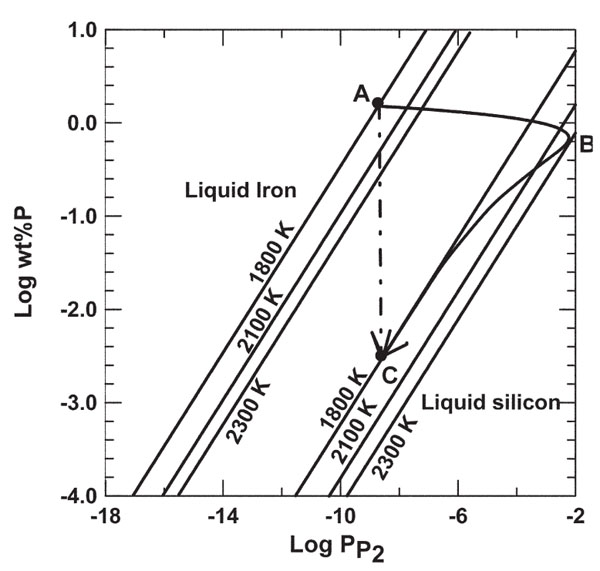
The volatility of P2(g) in equilibrium
with an Si-Fe alloy at 1,800 K
is presented in Figure 6, having been
computed using the data in Figure 5.9
Point A in the diagram corresponds to molten iron with 1.5 wt.% phosphorous
with the vapor pressure of P2 equal to
approximately 109 bar. Incremental addition
of silicon to molten iron leads to
a significant increase in P2(g) with only
a modest reduction in the concentration
of phosphorous in the alloy along the
path from point A to B. Point B corresponds
to 50 wt.% iron. Further addition
of silicon to the alloy leads to significant
decline in both P2(g) and concentration
of phosphorous in the alloy, the process
following conditions from point B to C.
Points A and C have nearly the same
value of P2(g), but the concentration of
phosphorous in iron versus that in silicon
is nearly three orders of magnitude
greater, reflecting the stabilizing effect
of iron on phosphorous at high temperatures.
If silicon is added incrementally to
the Fe-P droplets once exposed to the
furnace environment, phosphorous can
be volatilized. Unfortunately, lumps of
viscous silica, containing droplets of the
alloy, fall into the pool of molten silicon
or flow down the walls of the cavity into
the pool, where reaction of SiO2 with
silicon produces SiO(g). That reaction
exposes droplets of slag to reducing
conditions in the cavity that leads to the
formation of the Fe-P alloy, but in the
presence of excess silicon that quickly
dilutes the alloy, a condition characterized
by the path A-C in Figure 6. Since
reaction between SiO2 and silicon is
key to producing silicon, as indicated
by the reactions in Figure 2, nearly all
phosphorous entering the arc furnace in
quartz finds its way to the silicon.
Producers of s-Si seek quartz with
phosphorous content below 5 ppmw,
whereas producers of m-Si process
quartz with less than 50 ppmw phosphorous.7,11 Forty-five percent of the phosphorous
enters the arc furnace in the
quartz, 45% in the reducing agents, and
10% in the electrodes.7 The mass balance
for phosphorous in Figure 4 reveals
that 25% of the phosphorous leaves the
furnace with silica fume, and assuming
all the phosphorous in the quartz rock
leaves the furnace in the silicon, it is
estimated that processing phosphorousfree
quartz in the arc furnace will lead to
a 60% reduction of phosphorous in the
product. Since a typical value of phosphorous
in m-Si is 30 ppmw, processing
phosphorous-free quartz with conventional
reducing agents and electrodes
would yield silicon with a phosphorous
content of 12 ppmw, not the 1 ppmw or
less required for s-Si.
The likely source of the 25% of the
phosphorous leaving the arc furnace
in silica fume is reducing agents. Preprocessing
of electrodes at 1,523 K ensures
that phosphorous in that source is
chemically stabilized, most likely with
iron impurity. Fume forms just above
the top of the bed where SiO(g) mixes
with air and phosphorous condensed on
the silica fume (most likely as an oxide),
suggesting that much of the phosphorous
in reducing agents is not physically
trapped as in the quartz rock. For those
seeking to produce s-Si, a look at the
chemistry of phosphorous in reducing
agents could pay dividends.
Boron in the Arc Furnace
More than 95% of the boron entering
the arc furnace leaves in the silicon.7
The high boiling point temperature of
boron leaves one option for significantly
reducing its concentration in the product:
processing materials free of boron.
Since 37% of boron enters with the
quartz and 61% in the reducing materials,7 the reduction of boron content in
silicon is directly linked to the impurity
level in those two sources.
ACID TREATMENT
Elkems 1985 patent for purification
of m-Si by the Silgrain Process discloses
that some acid treatments of solidified
silicon yielded 90% removal of
phosphorous.12 It is essential to examine
what takes place in the Silgrain Process
before exploring how phosphorous
may have been removed in the process.
Purification of m-Si by the Silgrain
Process begins by maintaining a calcium-to-iron molar ratio in molten
silicon greater than 14, so that CaSi2
precipitates around primary grains of
silicon.13 Further removal of impurities
involves precipitation of other silicides.
Treatment of the lumps of solidified
material with 5% HCl solution leads to
chlorination of CaSi2 and formation of
the yellow phase that swells, cracking
open the lumps and exposing all the
CaSi2 to further reaction with acid. The
primary grains of silicon do not react
with the HCl solution. Warm water is
used to remove the water-soluble yellow phase and its impurity elements,
followed by treatment of the grains of
silicon with weak HF solution to remove
a thin layer of SiO2 surrounding
the silicon, a layer also containing impurity
elements. Again, the impurities
are washed away.
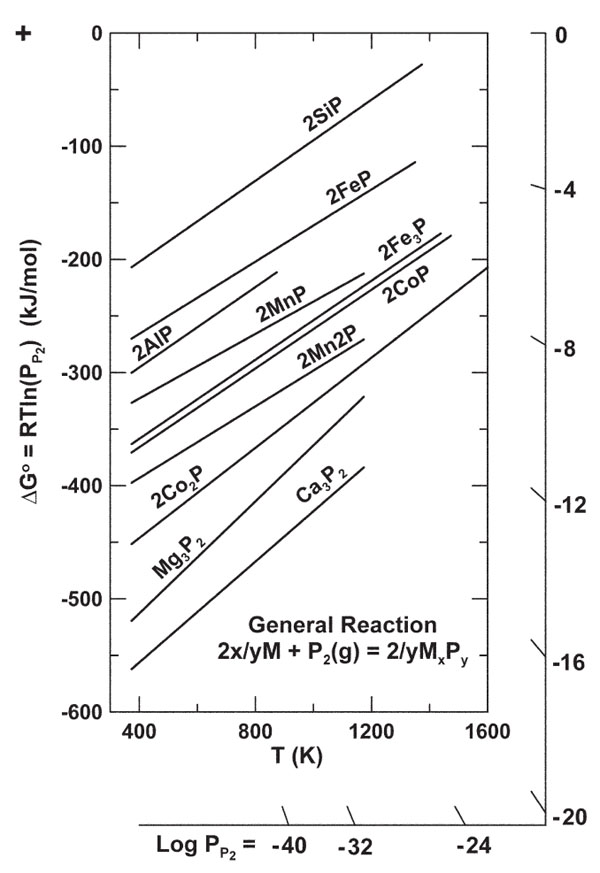
Removal of phosphorous from silicon
through the Silgrain Process must
involve formation of phosphides. The
Ellingham diagram for phosphides in
Figure 7 reveals that SiP is one of the
least stable phosphides, and that Fe,
Al, Mn, Co, Mg, and Ca would preferentially
form phosphides first with respect
to silicon, except for the fact that
those impurity elements are present in
the silicon at low concentrations. With
silicon present in excess, it is necessary
to examine the ability of phosphorous
to disrupt the bonding between silicon
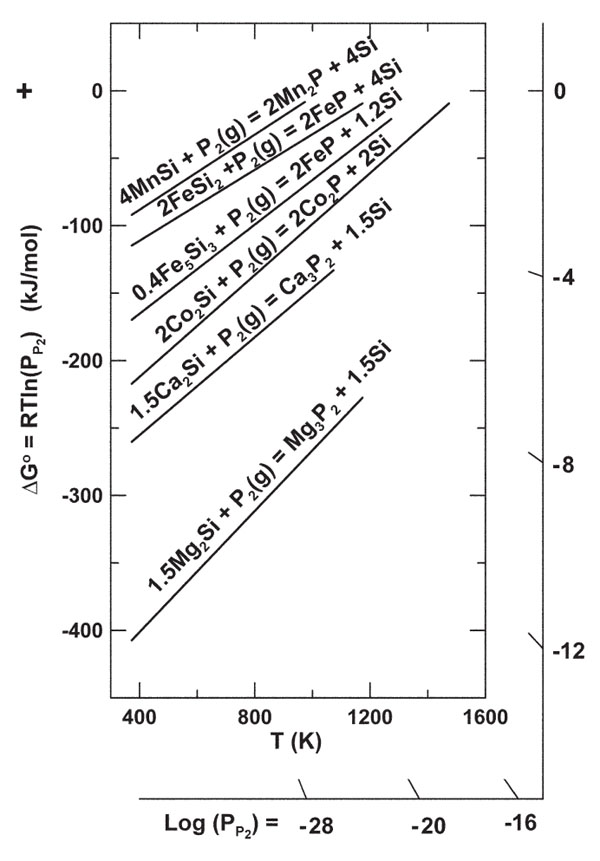
and the impurity elements.14 That is
accomplished by examining the ability
of P2(g) to form phosphides from
silicides, using the Ellingham diagram
in Figure 8. While the diagram in Figure
7 indicates that calcium forms the
most stable phosphide, the thermodynamic
calculations presented in Figure
8 suggest that magnesium dissolved
in silicon appears to have the greatest
ability to form a phosphide. The actual
situation is complex; one must take into
account that some elements dont form
mono-silicides and thus arent included
in Figure 8, and all elements appear to
form binary, ternary, and more complex
silicides for which there are no thermodynamic
data. Additional issues involve
the concentration of impurity elements
and their activity in silicon. While Mg
appears to be more suited for forming a
phosphide, there is far greater concentration
of Al, Ca, and Fe in m-Si than
Mg. Phosphide formation is not strictly
a thermodynamic issue, but involves kinetics
and transport issues as well.
REFINING
The Holy Grail for those seeking
to refine silicon for PVs is a single economic
process whereby both boron and
phosphorous are removed to acceptable
concentrations. Thus, research into refining
silicon has focused on those elements.
Boron
The earliest refining process for boron
involved gas injection and volatilization
of boron-containing compounds. More
recently the focus has been on slagging.
Volatilization of boron from molten
silicon was linked to H2-H2O vapor by
Theuerer,15 who reported that during
zone refining of silicon, inclusion of
water vapor with the protective H2 atmosphere
significantly increases the resistivity
of silicona result attributed to
volatilization of boron-containing species.
Theuerers results no doubt inspired
researchers to pursue this approach. An
early report set the vapor pressures of
BO, BO2, and B2O3 at values of 74, 0.15,
and 0.056 Pa, respectively, for treatment
of molten silicon at 2,273 K.16 Using
available data for the activity of boron in
molten silicon,14 assuming the initial boron
content in the silicon to be 15 ppmw,
and using the maximum
O2 p associated
with the Si-SiO2 equilibrium, the vapor
pressures of the oxides are computed
to be no larger than 0.54, 1.2.103, and
7.7.104 Pa, respectively. (Typical boron
content in metallurgical silicon today
ranges from 15 to 20 ppmw.) Further
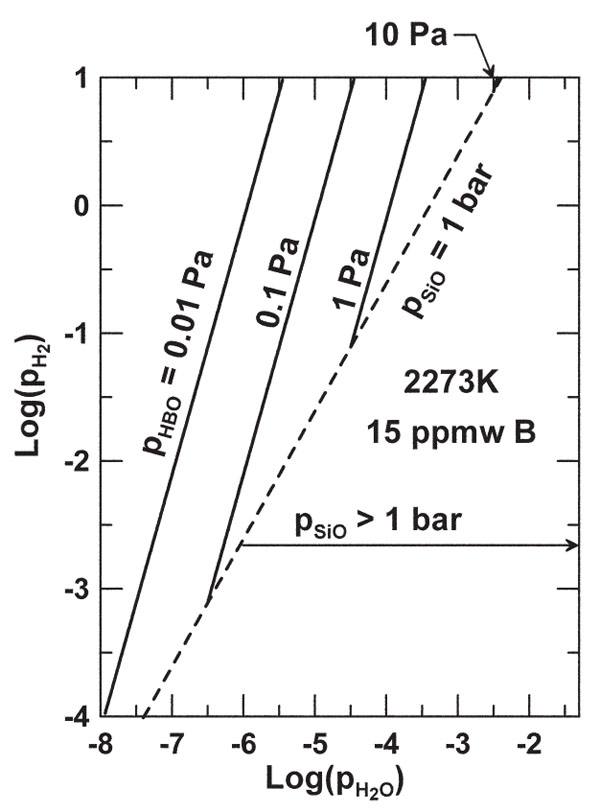
thermodynamic analysis indicates that
the prominent boron species volatilized
with an H2-H2O gas injection is likely
HBO, and not the oxides. The volatility
of HBO has been computed, and
results plotted in Figure 9 for the conditions
used to compute the latest partial
pressures for the oxides. The diagram
includes the conditions beyond which
SiO(g) exists at a pressure of 1 bar, the
practical limit for sparging with H2-H2O.
Generation of SiO(g) cant be stopped,
as it decomposes to SiO2 and silicon
upon contacting a cooler surface. The
maximum vapor pressure of HBO at 1
bar total pressure is limited to about 5 Pa
and will decline significantly as boron is
volatilized. A large volume of gas will
be required, and substantial loss of silicon
by SiO volatilization will occur.
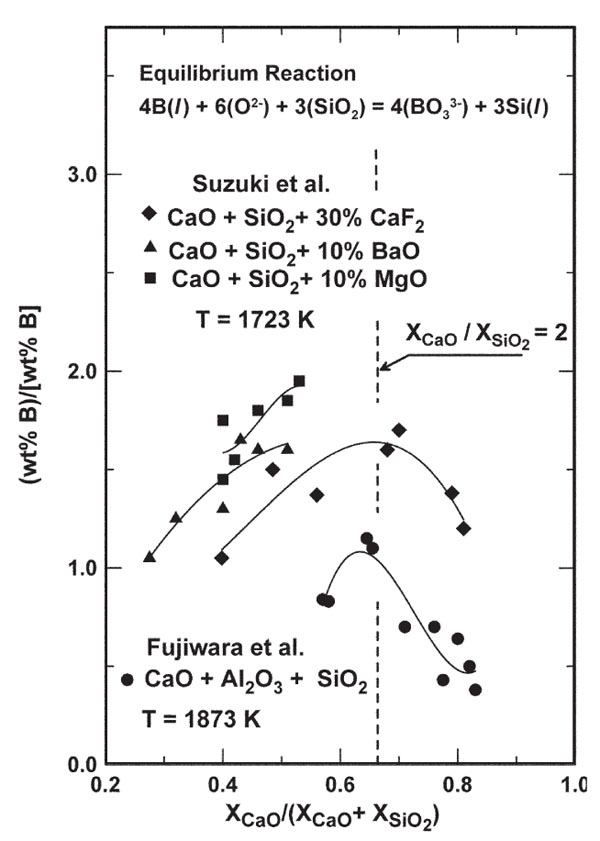
Boron removal by distribution with
oxide slags is largely based on the research
of Suzuki et al.,17 and Fujiwara
and co-workers.18 A summary of their
experimental results is presented in Figure
10 where the distribution of boron
between slag and silicon is plotted versus
slag composition. The distinct feature in
the diagram is the maximum occurring
in all cases near the orthosilicate, as represented
where the ratio of the mole fractions
of CaO to SiO2 is equal to 2. The
orthosilicate occurs at smaller values of
the ratio in slags containing BaO and
MgO. The refining capability for boron
(i.e., formation of BO3-3 ions in slag) is dependent on the activity of SiO2 and the
concentration of oxygen anions (O2) in
the slag, as indicated by the chemical reaction
in the figure. Unfortunately, a rise
in the value of one leads to a decline in
the other, producing a maximum distribution
of boron between slag and silicon
at the orthosilicate.19
Phosphorus
Efforts to remove phosphorous from
silicon have involved volatilization combined
with vacuum treatment, and slagging.
Volatilization of a solute is usually
based on the vapor pressure of the solute
being greater than that of the solvent.
The opposite is the case for elimination
of phosphorous from silicon, but
the mass of phosphorous is small and
thus the loss of silicon is acceptable.
At 1,973 K the equilibrium molar ratio
of phosphorous to silicon, in the vapor
phase, ranges from 2×10⁴ to 7×10⁶ as
the concentration of phosphorous is reduced
from 30 ppmw to 1 ppmw, while
it is computed that 290 moles of silicon
are lost per mole of phosphorous volatilized.
That loss, while appearing to be
significant, amounts to less than 1% of
the silicon refined.
Experimental results in Table I reveal
that volatilization at elevated temperatures
is effective for removing many elements.
Pires et al.20 used e-beam vacuum
heating to fuse silicon buttons 25
mm thick and 90 mm in diameter over
a period of 20 minutes at e-beam power
levels of 15 to 17 kW at pressures of
104 to 102 Pa. A comparison of results
in Table I with the boiling point temperatures
in Figure 4 suggests, as a result
of significant reduction of aluminum
content by e-beam melting, that surface
temperature of the silicon buttons was
approaching that of the boiling point of
aluminum. Unfortunately, as might be
expected from boiling point temperatures,
boron content is not reduced to the
desired concentration of 1 ppmw for solar
silicon, nor can it as its boiling temperature
is greater than that of silicon.
Thus a separate refining step for boron
is required.
Research into distribution of phosphorous
between silicon and slag has
largely focused on the impact of CaO
in slag reacting with phosphorous in
silicon, forming Ca3P2 that dissolves in
the slag. The ionic form of the reaction
is included in Figure 11b. Much of the
attention on CaO is based on the thermodynamic
stability of Ca3P2 observed
in Figure 7.
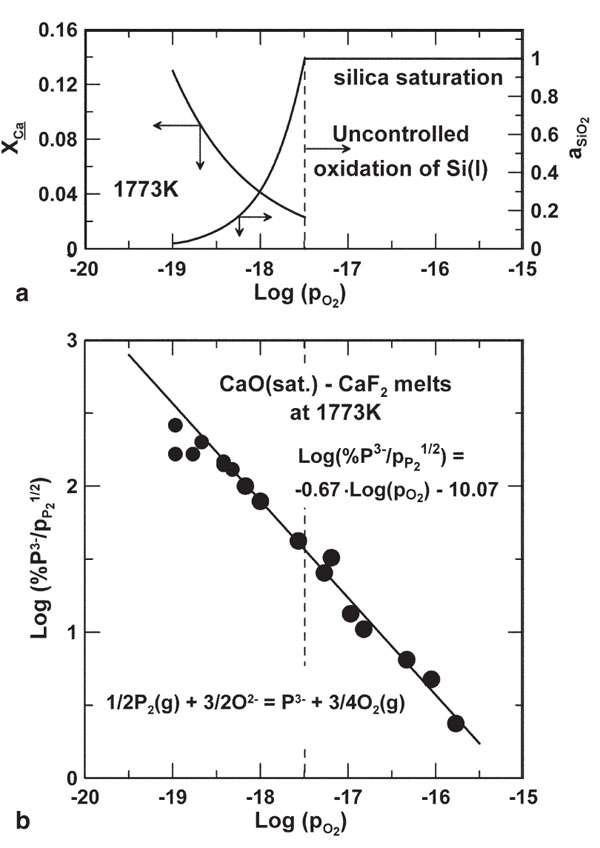
Tabuchi and Sano21 measured the solubility
of phosphorous in the CaO-CaF2
melts by equilibrating phosphorous vapor
with the melt at various partial pressures
of O2. They showed that equilibrium
can be represented by the reaction
in Figure 11 where the source of oxygen
anions is CaO and the negative charge on
the P3- anion in slag is neutralized by the
Ca2+ cations. The data in Figure 11 indicate
that reducing the partial pressure
of O2 increases the solubility of phosphorous
in slag; the chemical reaction in
the diagram suggests that selection of a
slag where it is possible to increase the
O2ion content (i.e., increasing the slag
basicity) will further improve solubility
of phosphorous in slag.
Those conclusions, based on experimental
results obtained with a system absent
elemental silicon, are only partially
correct. Decreasing PO2
and increasing the basicity of slag by the addition of
CaO to slag in the presence of molten
silicon leads to increased concentration
of calcium in the silicon, and in turn increased
concentration of phosphorous in
that phase. The presence of additional
calcium can, through ternary interaction,
draw phosphorous from slag back
into molten silicon. While CaO is a very
stable oxide, as the data in Figure 3 supports,
preferred bonding between calcium
and silicon, and formation of SiO2
(or SiO(g)) leads to the decomposition
of the oxide and increased concentration
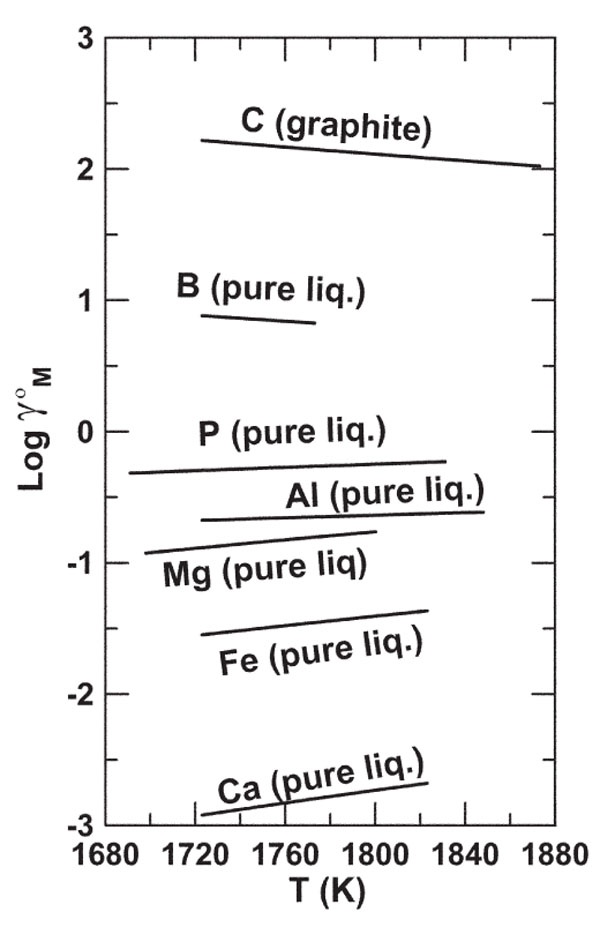
of calcium in silicon. The extent of preferred
bonding between calcium and silicon
can be quantitatively evaluated by
comparing Henrian activity coefficients
(γ0i) for solutes in molten silicon.14,2226
That comparison is available in Figure
12, where calcium is, by virtue of its position
at the bottom of the diagram, the
most stable solute. Thermodynamic data
for the formation of CaO and SiO2 and
the value of γ0Ca in Figure 12 at 1,773
K were used to compute the solubility of
calcium in molten silicon, and the activity
of SiO2 in slag at CaO saturation and
for values of
Po2 in Figure 11. Those results
included in the upper graph in the
figure indicate that at the lowest value of
Po2 the mole fraction of calcium in the
silicon (XCa) is in excess of 0.1. Also it
is clear that much of the solubility data
in the lower graph is at values of
Po2 above the saturation level for SiO2, and
not applicable for refining of silicon.
The ternary impact of deoxidizing
agents on the solubility of oxygen dissolved
in molten iron produces a minimum
solubility of oxygen, followed
by increasing concentration of oxygen
with increasing content of the deoxidizing
agent.27 Increasing concentration of
calcium in molten silicon has the same
impact on the solubility of phosphorous.
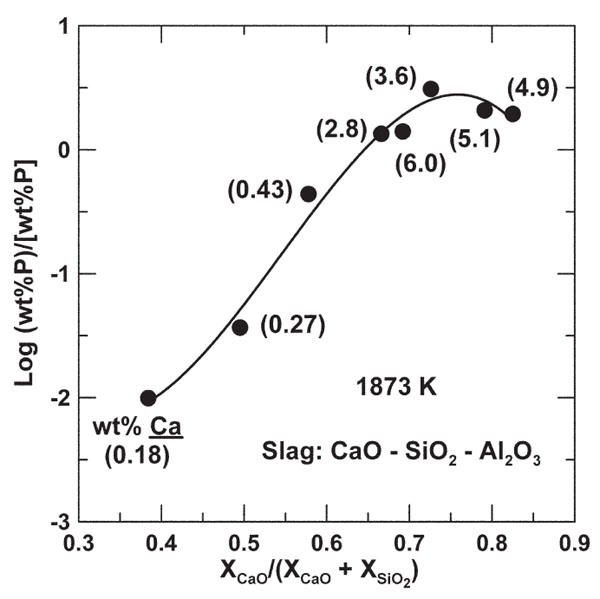
However, when the ternary effect
is viewed through the distribution of
phosphorous between slag and silicon, a
maximum is observed as shown in Figure
13. The final concentration of calcium
in the silicon, provided in parentheses
with each data point, show a marked
increase with increasing CaO content
in slag. The impact of the ternary effect
leads to greater retention of phosphorous
in molten silicon.
SOLIDIFICATION REFINING
Refining by UDS, an established procedure,
moves impurity elements to one
end of an ingot. The procedure is well
documented in the literature,29 and thus
not considered further, except to note
that it has no impact on removing boron
from silicon, and can reduce phosphorous
content to 35% of the initial concentration
in the molten alloy for the first
material solidified; at 80% solidification
the content of phosphorous in the ingot
is at approximately 85% of the initial
concentration. The overall phosphorous
content of the ingot (at 80% solidification)
is approximately one-half the initial
concentration. Thus m-Si with 30 ppmw
phosphorous will produce an ingot with
a concentration ranging from 10 to 26
ppmw phosphorous with a single UDS,
but with an overall phosphorous content
of 15 ppmw. Second and third UDS
procedures produce ingots with overall
phosphorous content of 7.5 and 3.8
ppmw, respectively. The variation in the
phosphorous content in the final ingot
ranges from 2.6 to 6.4 ppmw. Cropping
the top 20% of each fully solidified ingot
produces a final yield of refined silicon
of 50 percent with three UDS steps.
An alternative approach to UDS is recrystallization
from an alloy.30,31 Silicon
must be the primary phase solidified,
and the only phase solidified. Aluminum
is one element that does not form
a mono-silicide, and thus has received
considerable attention as a solvent for
silicon recrystallization. It also has the
advantage of having a melting temperature
substantially lower than silicon, and
forms a eutectic point at 850 K at 87.4
wt.% silicon. Use of aluminum as solvent
allows for low temperature solidification
over a wide composition range
for the alloy.
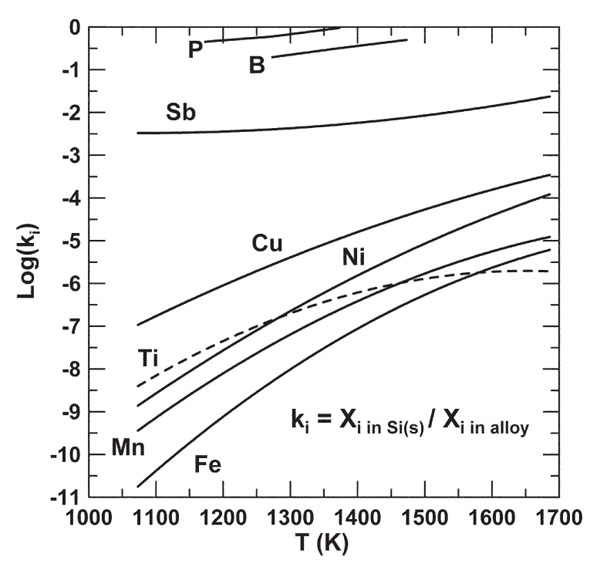
Morita and co-workers examined the
ability of using aluminum as solvent for
recrystallization of silicon.3133 Some of
their results for the measured segregation
coefficients for impurities, ki, are
presented in Figure 14. The coefficient
is the ratio of the mole fraction of the
impurity in the silicon solidified versus
the mole fraction of that element in the
molten alloy. The smaller the value of
ki the greater is the extent of removal of
that element from solid silicon. Unfortunately,
recrystallization of silicon from
an Si-Al alloy has the least impact on removal
of boron and phosphorous.
CONCLUSIONS
How to Win the Race for Solar
Silicon
Limiting factors that impact the potential
of using a metallurgical route for
producing s-Si were examined. If these
factors are truly limiting, what are the
options for producing s-Si?
Carbothermic Reduction of Silica
Myrhaug and Tveits7 boiling point
model and subsequent mass balances
for production of ferrosilicon in a submerged
arc furnace provide information
as to the source of impurity elements
and the extent to which they end up in
the product. If s-Si is to be produced directly
from quartz and reducing agents
they must be substantially free of impurity
element, with no more than a total
impurity content of 1 ppmw per kg of
silicon produced. If the intent is to produce
low boron and phosphorous content
silicon that is to be further refined
by UDS, the limitation applies to those
elements only.
FESIL is developing the Solsilc Process,34 where high-purity quartz and reducing
agents are being processed. Natural
gas is cracked to produce a high-purity
carbon black that is combined with
quartz and SiC fines using a high-purity
binder. No wood chips or coal, which
are significant sources of impurities,
are used in the reduction process. The
higher cost of raw materials is offset by
fewer refining steps.
Fine grain deposits of silica sand exist.
Those sands with low impurity content
can be autoclaved with an acid wash
or other solvent to further cleanse them
of impurities; for example Ca3(PO4)2 is
soluble in dilute acid and B2O3 is soluble
in water and ethanol. The finer the sand
the greater the surface area per unit volimpurities can be removed by this process.
The recovered silica can be mixed
with high-purity reducing agents and
consolidated by sintering or with a highpurity
binder, and then processed in an
arc furnace.
Acid Treatment
Removal of 90% of the phosphorous
in m-Si by acid treatment, as reported in
Elkems patent,12 can reduce the phosphorous
content from 30 to 3 ppmw.
Following the procedure described with
respect to solidification refining, a single
UDS will produce an ingot with phosphorous
content varying between 1 and
2.6 ppmw, with 80% yield.
Volatilization
Volatilization techniques are limited
by low vapor pressures of volatiles. The
issue is made difficult by the initial low
concentration of elements to be volatilized
and their decreasing concentration
during processing. Large volumes of gas
are required and must be effectively distributed
through the silicon. Long process
times are required. A combination
of different sparging gases with slag formation
can speed the refining process.
The sparging gas is eliminated in ebeam
heating, but the heating must be
conducted under ultra-high vacuum that
severely impacts the economics of volatilizing
impurities. Heating is limited to
a thin layer no more than 1 to 3 cm depending
on the power employed. A major
drawback is the small surface area of
silicon that is heated.
JFE (Kawasaki Steel) has combined
vacuum e-beam heating of a thin sheet of
silicon, and e-beam heating with UDS.35 That approach, effective in reducing the
concentration of many impurities, including
phosphorous, must be followed
with a separate step to remove boron.
The ingot from the UDS step is crushed
and melted using a non-transferred arc
plasma torch. An H2-H2O gas is used to
volatilize boron. A conventional UDS
step completes the process.
Slagging
Oxide slags with equilibrium mass
distribution ratios of 2 and 3 for boron
and phosphorous are severely limited in
their ability to refine m-Si. Thus, fluxing
agents free of boron and phosphorous
are required to form a slag. Elkem Solar
patented a concept for producing a lowphosphorous
slag from inexpensive raw
materials containing phosphorous by
utilizing data in Figure 5.36 Ferrosilicon
with more than 65 wt.% iron provides
for greater solubility of phosphorous in
the melt versus molten silicon. Elkem
Solar fused slag admixtures in the presence
of ferrosilicon containing 8090%
iron to draw phosphorous from the slag
into the ferrosilicon. The resulting slag
is then used in the refining of m-Si. This
approach allows for more freedom for
utilizing a slag that has greater capacity
for boron while still removing phosphorous.
The small distribution ratios obtained
with an oxide slag for boron and phosphorous
removal also require large mass
of slag, far exceeding the mass of silicon
refined. Elkem Solar37 and Nippon
Steel38 in their patents approached this
problem with counter current and semicounter
current processes that have the
potential to reduce the mass of slag by
an order of magnitude. In one patent38
10 to 100 batches of slag were allowed
to equilibrate separately with silicon and
then removed. Use of multiple reaction
vessels in series has been proposed.36
For a slag to act as an effective sink
for both boron and phosphorous requires
favorable thermodynamics for the exchange
reactions involving transfer of
impurity elements from silicon to slag,
and a slag that has favorable bonding
that reduces the activity coefficient of
the constituents containing the impurity
elements in slag. Oxide slag has little
capacity for boron and phosphorous in
refining silicon.
Of all the slag systems proposed,
that containing Si3N4 has the greatest
thermodynamic potential for removal
of boron from silicon.3941 The slagging
operation involves an exchange reaction
between the slag and molten silicon
where Si4N4 in slag supplies nitrogen
to remove boron from silicon through
formation of BN that dissolves in slag.
The advantage of this approach, beyond
favorable thermodynamics, is that there
are no counteracting effects as occurs
in oxide slag with boron as observed in
Figure 10. Lynch and Øye41 identified
a system where activities of Si3N4 and
Al2O3 in slag can have maximum values
for transferring boron and phosphorous
to slag as BN and AlP. Lynch and Øye
also proposed how the composition of
the slag can be adjusted to decrease the
activity coefficients of boron and phosphorous,
further improving the refining
ability of slag.
Recrystallization of Silicon from
Alloys
Recrystallization of silicon from an
Al-Si alloy is only marginally effective
in removing boron and phosphorous.
This approach suffers from the same
problem as oxide slag, namely the need
to use alloying agents with a very low
concentration of boron and phosphorous.
With the Al-Si alloy the concentrations
of boron and phosphorous will
quickly rise above acceptable levels with
silicon recrystallization. The alloy must
either be cleansed of impurities or sold.
The economic impact can be minimized
by utilizing an alloying agent that has
substantially smaller segregation coefficients
for boron and phosphorous than
with aluminum as solvent.
Removal of the molten alloy is a
problem after recrystallization. Nichol
has proposed42 decanting the alloy, using
a high-temperature press to squeeze
out trapped liquid. If necessary, the
resulting slush can be remelted and recrystallization
repeated. Reheating the
silicon-rich slush will push the melting
temperature toward the normal fusion
temperature of silicon, thus much of the
advantage of working with an alloy at
lower temperatures is lost.
REFERENCES
1. M.G. Mauk, P.E. Sims, and R.B. Hall, AIP Conf.
Proc., 404 (1) (1997), pp. 2128.
2. B. Alpert, Nightfall Comes to Solar Land, Barrons
On Line (30 March 2009), http://online.barrons.com /article/SB123820188149562545.html.
3. RBC Capital Markets ReportRBCs Daily Snapshot,
Global Clean Energy Directions (28 May 2009).
4. A. Feltrin and A. Freundlich, Renewable Energy, 33
(2) (2008), pp. 180185.
5. W. Hoffmann, Toward an Effective European Industrial
Policy for Photovoltaics (Paper presented at 20th
EPIA AGM, Athens, Greece, 78 May 2004).
6. A. Schei, J.Kr. Tuset, and H. Tveit, Production of High
Silicon Alloys (Trondheim, Norway: Tapir, 1998), p. 61.
7. E.H. Myrhaug and H. Tveit, Material Balances of
Trace Elements in the Ferrosilicon and Silicon Processes,
Electric Furnace Conference Proceedings
Vol. 58 (Warrendale, PA: AIST, 2000), pp. 591604.
8. A. Schei, J.Kr. Tuset, and H. Tveit, in Ref. 6, p. 90.
9. D.C. Lynch, Proceedings of the Silicon for the
Chemical Industry VII, ed. H.A. Øye, A. Holåa, and L.
Nygaard (Trondheim, Norway: Dept. Mat. Tech. NTNU,
2004), pp. 1731.
10. S. Ueda, K. Morita, and N. Sano, Metall. & Mat.
Trans. B, 28B (6) (1997), pp. 11511155.
11. V. Dosaj, Dow Corning, private communication with
author (May 2009).
12. G. Halvorsen, Method for Production of Pure Silicon, U.S. patent 4,539,194 (3 September 1985).
13. A. Schei, J.Kr. Tuset, and H. Tveit, in Ref. 6, pp.
285291.
14. D.C. Lynch, Proceedings of the Silicon for the
Chemical Industry VI, eds. H. A. Øye, H. Rong, L.
Nygaard, G. Schussler, and J. K. Tuset (Trondheim,
Norway: Dept. Chem. NTNU, 2002), pp. 7391.
15. H.C. Theuerer, J. Metals, 8 (1956), pp. 13161319.
16. N. Yuge et al., Sol. Energy Mater. Sol. Cells, 34 (1-
4) (1994), pp. 243250.
17. K. Suzuki and N. Sano, 10th Int. E.C. Photovoltaic
Sol. Energy Conf. Proc, ed. L. Antonio (Dordrecht,
Neth.: Kluwer, 1991), pp. 273275.
18. H. Fujiwara et al., JIM, 60 (1) (1996), pp. 6571.
19. D.C. Lynch and M. A. Lynch, in Ref. 9, pp. 307
318.
20. J.C.S. Pires et al., J. Mat. Proc. Tech., 169 (1)
(2005), pp. 2125.
21. S. Tabuchi and N. Sano, Metall. Trans. B, 15B (6)
(1984), pp. 351356.
22. A.I. Zaitsev, N.E. Shelkova, and A.A. Kodentsov, J.
Phase Equilibria, 21 (6) (2000), pp. 528533.
23. T. Miki, K. Morita, and N. Sano, Metall. & Mat. Trans.
B, 29B (5) (1998), pp. 10431049.
24. M. Tanahashi, T. Fujisawa, and C. Yamauchi, Value-Addition Metallurgy, ed. W.D. Cho and H.Y. Sohn
(Warrendale, PA: TMS, 1998), pp. 103109.
25. K. Yanaba et al., Mat. Trans. JIM, 38 (11) (1997),
pp. 990994.
26. T. Miki, K. Morita, and M. Yamawaki, J. Mass Spectrom. Soc. Japan, 47 (2) (1999), pp. 7275.
27. C.H.P. Lupis, Chemical Thermodynamics of Materials (New York: Elsevier Sci., 1983), pp. 257259.
28. H. Fujiwara et al., Mat. Trans. JIM, 37 (4) (1996),
pp. 923926.
29. W.G. Pfann, Zone Melting, 2nd ed. (New York:
Wiley, 1966).
30. E.A. Good et al., 12th Workshop on Crystalline
Silicon Solar Cell Materials and Processes: Extended
Abstracts and Papers, ed. B.L. Sopori (Golden, CO:
NREL, 2002), pp. 236239.
31. K. Morita and T. Yoshikwa, Proceedings of the
Silicon for the Chemical and Soar Industry IX, ed. H.A.
Øye et al. (Trondheim, Norway: Dept. Mat. Sci. and
Engr. NTNU, 2008), pp. 5159.
32. T. Yoshikwa and K. Morita, Metall. & Mat. Trans. B,
36B (4) (2005), pp. 731736.
33. T. Yoshikwa and K. Morita, Sci. & Tech. Adv. Mat., 4
(2003), pp. 531537.
34. L. Nygaard, in Ref. 31, pp. 143155.
35. N. Yuge et al., Prog. Photovolt. Res. Appl., 9 (3)
(2001), pp. 203209.
36. E. Enebakk et al., A Calcium-Silicate Based Slag
for Treatment of Molten Silicon, WIPO patent application
03/097528 A1 (27 November 2003).
37. A. Schei, Method for Refining Silicon, EP patent
0 699 625 B1 (24 March 1999).
38. N. Ito et al., Apparatus and Process for Producing
High-Purity Silicon, EP patent application 1,958,923
A1 (20 November 2008).
39. J.V.D. Avyle, P. Ho, and J.M. Gee, Silicon Purification
Melting for Photovoltaic Applications-SAND 2000-
0821 (Sandia National Laboratories, NM: DOE April
2000).
40. R. F. Clark et al., Method and Application for Purifying
Silicon, WIPO patent application 02/16265 (28
February 2002).
41. D. C. Lynch and H. A. Øye, Silicon Refining Process,
U.S. patent application 2007/0245854 A1 (25
October 2007).
42. S. Nichol, Method for Purifying Silicon, WIPO patent
application 2007/112592 A1 (11 October 2007).
David Lynch is Professor of both Mining Engineering
and Materials Science and Engineering, and is
also with the Lowell Institute for Mineral Resources
at the University of Arizona, 12235 East James
E. Rogers Way, Tucson, AZ 85721; (520) 626-6022;
e-mail dclynch@email.arizona.edu. |
 Presenting a Web-Enhanced